Overview
As a project manager, there may be a need to see the performance of each developer in the current sprint
With Multiple Filters Chart Gadget, It is possible to generate data table like this by defining a separate filter for each column
|
Developer |
No. of Stories Completed |
Total Story Points Completed |
No. of Bugs Fixed |
Total Hours Spent |
|---|---|---|---|---|
|
Alex |
4 |
32 |
0 |
40 |
|
Bob |
3 |
9 |
3 |
38 |
|
Charlie |
6 |
18 |
0 |
40 |
Set up
1. Create the following filters with the following JQL
|
Column |
Filter Name |
Filter JQL |
|---|---|---|
|
No of Stories Completed |
PROJECTKEY - Stories in the current sprint |
|
|
Total Story Points Completed |
Can reuse the previous filter |
|
|
No. of Bugs Fixed |
PROJECTKEY - Issues in the current sprint |
|
|
Total hours Spent |
PROJECTKEY - Issues in the current sprint |
|
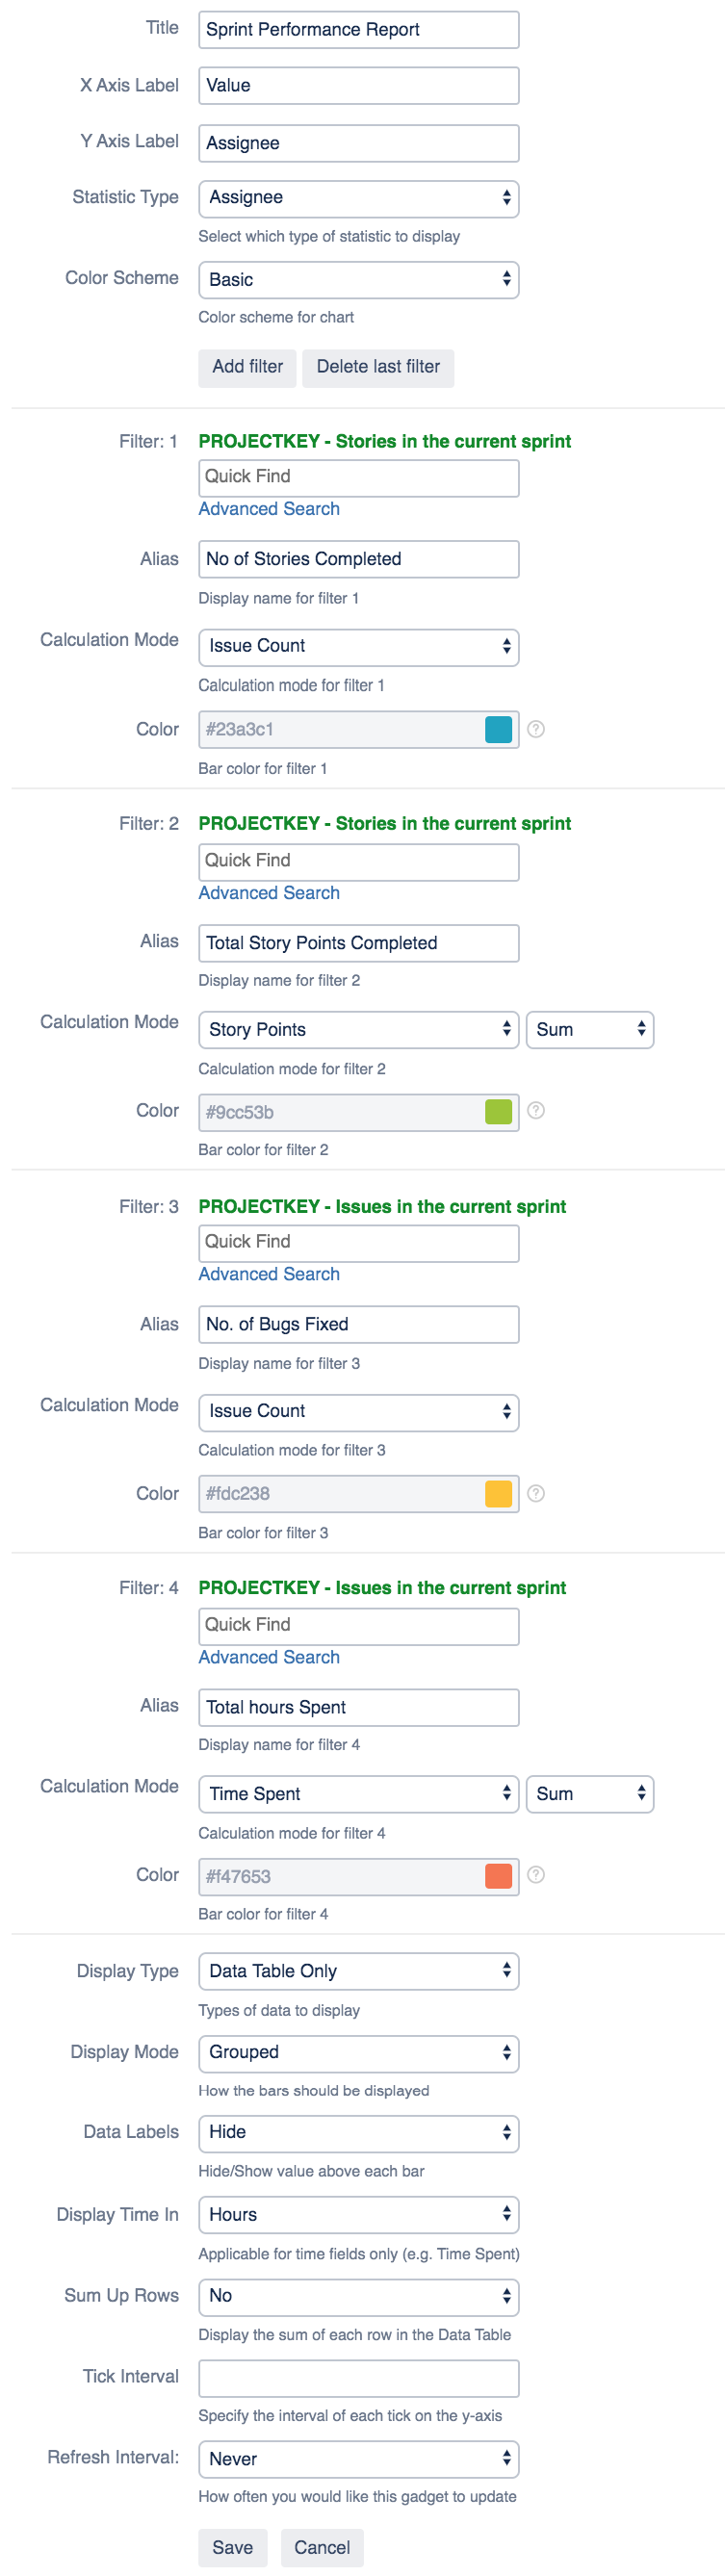
2. Add a Multiple Filters Statistic Bar Chart Gadget (Horizontal) gadget
-
Add a Multiple Filters Statistic Bar Chart Gadget (Horizontal) gadget in the dashboard
-
Add the 4 filters defined above
-
For the 2nd filter to display the Total Story Points Completed, you can choose to Sum by Story Points instead of the default issue count
-
For the 4th filter to display the Total hours Spent, you can choose to Sum by Time Spent
-
You can choose to hide or display the horizontal chart