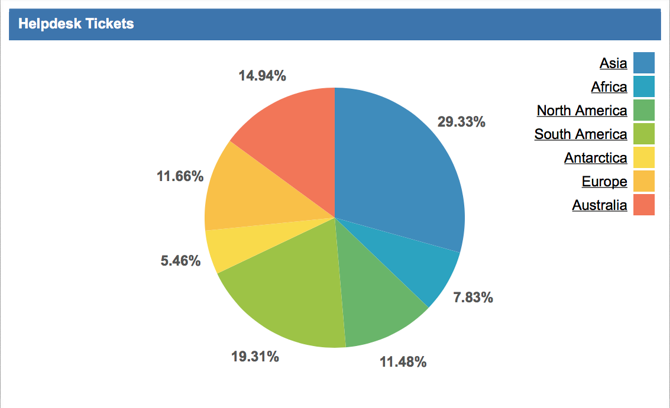
Grouping helpdesk tickets by region
It is possibly to group the helpdesk tickets by region or customer tier
For a simplified example, if Jira is set up with a select custom field named Country with the following options
-
Australia
-
Brazil
-
China
-
Canada
-
France
-
India
-
Japan
-
Germany
-
Russia
-
United Kingdom
-
United States
You can define multiple filters according to the region
|
Region |
Countries |
JQL |
|---|---|---|
|
Asia |
China, India, Japan |
countries in (China, India, Japan) |
|
Europe |
France, Germany, Russia, United Kingdom |
countries in (France, Germany, Russia, "United Kingdom") |
|
North America |
Canada, United States |
countries in (Canada, United States) |
|
South America |
Brazil |
countries in (Brazil) |
|
Oceania |
Australia |
countries in (Australia) |
Combined reporting across multiple projects
A scenario is to for management to track the number of user stories completed by each team in the current month.
You can define multiple filters and feed them into the Multiple Filters Chart Gadget
|
Team |
Project |
JQL |
|---|---|---|
|
A |
Mercury, Venus, Mars |
issuetype = "User Story" AND resolutiondate >= startOfMonth() AND project in (Mercury, Venus, Mars) |
|
B |
Ruby, Diamond, Sapphire |
issuetype = "User Story" AND resolutiondate >= startOfMonth() AND project in (Ruby, Diamond, Sapphire) |
|
C |
Zeus, Apollo, Artemis |
issuetype = "User Story" AND resolutiondate >= startOfMonth() AND project in (Zeus, Apollo, Artemis) |
Tracking the number of feedback
A commonly requested feature is to track the number of times the ticket is bounced between the agent and the customer.
This is possible to do that with the Jira Misc Custom Fields.
To address the requirements of classifying the types of ticket, you can define in the like of following JQL filters
|
Category |
Rule |
JQL |
|---|---|---|
|
Fast |
Those that are resolved immediately |
project = ServiceDesk and created > startOfMonth() and created <= endOfMonth AND transitionCount = 1 |
|
Normal |
Those that take 2 to 3 interactions |
project = ServiceDesk and created > startOfMonth() and created <= endOfMonth AND transitionCount >= 2 AND transitionCount <= 3 |
|
Long |
Those that takes more than 3 interactions |
project = ServiceDesk and created > startOfMonth() and created <= endOfMonth AND transitionCount >= 4 |
Grouping of workflow statuses
For a complex workflow which have more than 10 statuses to facilitate granular tracking, it will be very difficult for high level reporting. You can have the best of both worlds by using the plugin to group related workflow statuses together
|
Stage |
Statuses |
JQL |
|---|---|---|
|
Analysis |
|
status in (open, "Pending estimation", "Pending approval", "Design") |
|
Development |
|
status in (Development, "Pending vendor") |
|
Testing |
|
status in ("Pending SIT", "Pending UAT") |
|
Deployment |
|
status in ("Pending Deployment", "Pending User Confirmation") |
|
Completed |
|
status in ("Resolved", "Closed") |
Reporting on the number of days to close the ticket
It is possible to calculate the time taken from creation of closing the ticket in Jira with the solution from How can I calculate time to close?
|
Rule |
JQL |
|---|---|
|
those which take less than 1 day |
timeTaken < 1440 |
|
those that takes 1 day or not |
timeTaken >= 1440 |
Reporting on Cascading Fields
It is possible to group the issues by the parent value. In the example below, we have a cascading field named Plugin with the following options
-
Confluence
-
Attachment Checker for Confluence
-
Countdown Timer Plugin
-
Inspire
-
-
Jira
-
Attachment Checker for Jira
-
Gauge Gadgets
-
Multiple Filters Chart
-
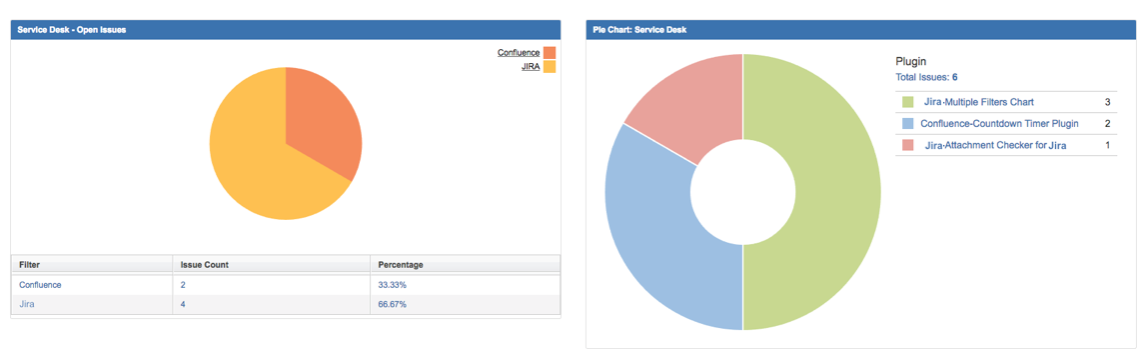
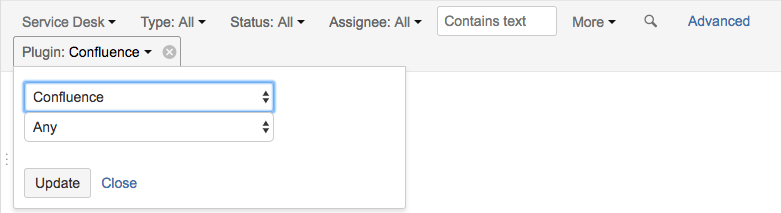
First, you need to create the filters with the parent values. We created 2 filters - Confluence and Jira
The Multiple Filters Pie Chart (on the left) will group by the parent value whereas Jira in-built Pie Chart (right) will enumerate all the permutations