Summary
New Features
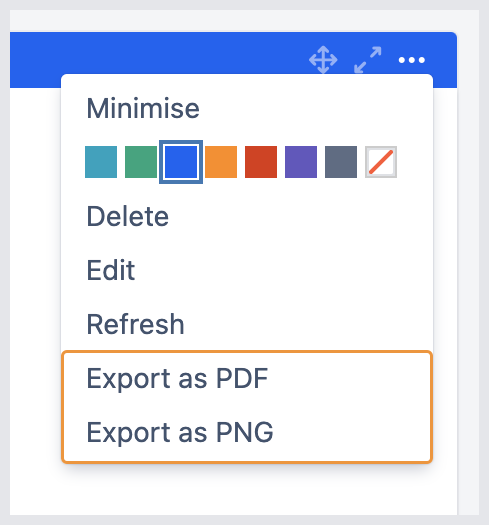
Export as PDF or PNG
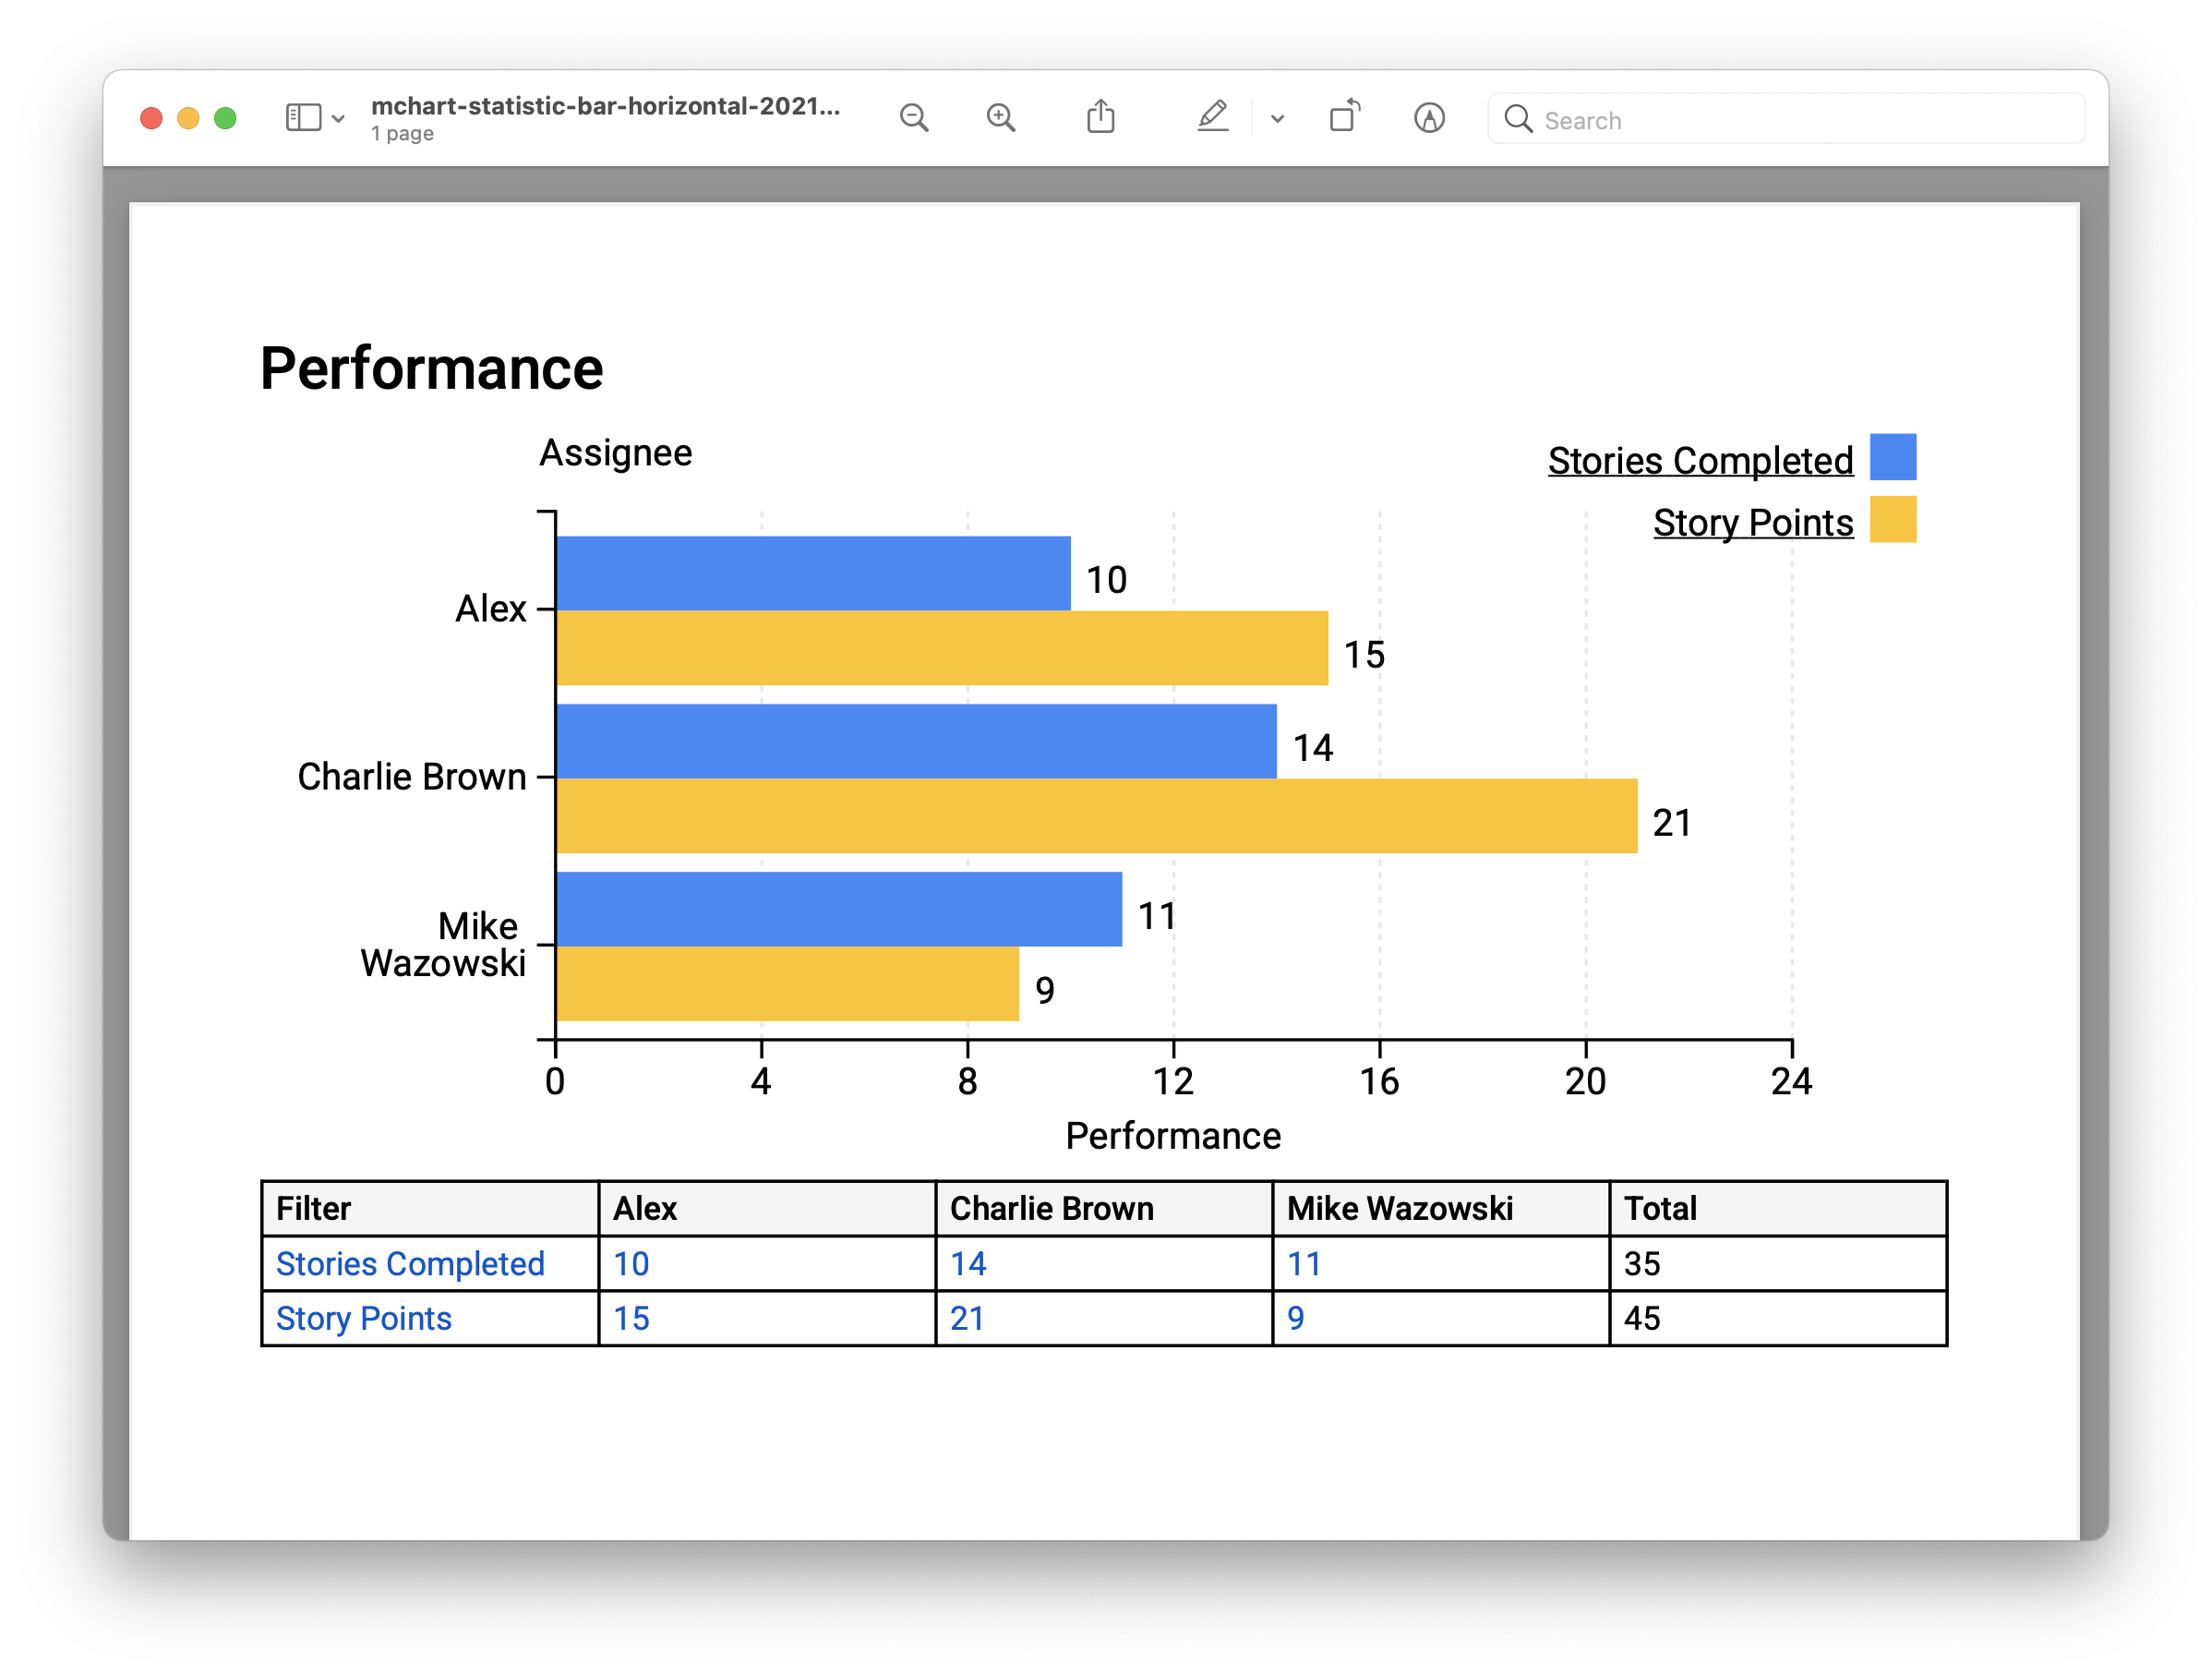
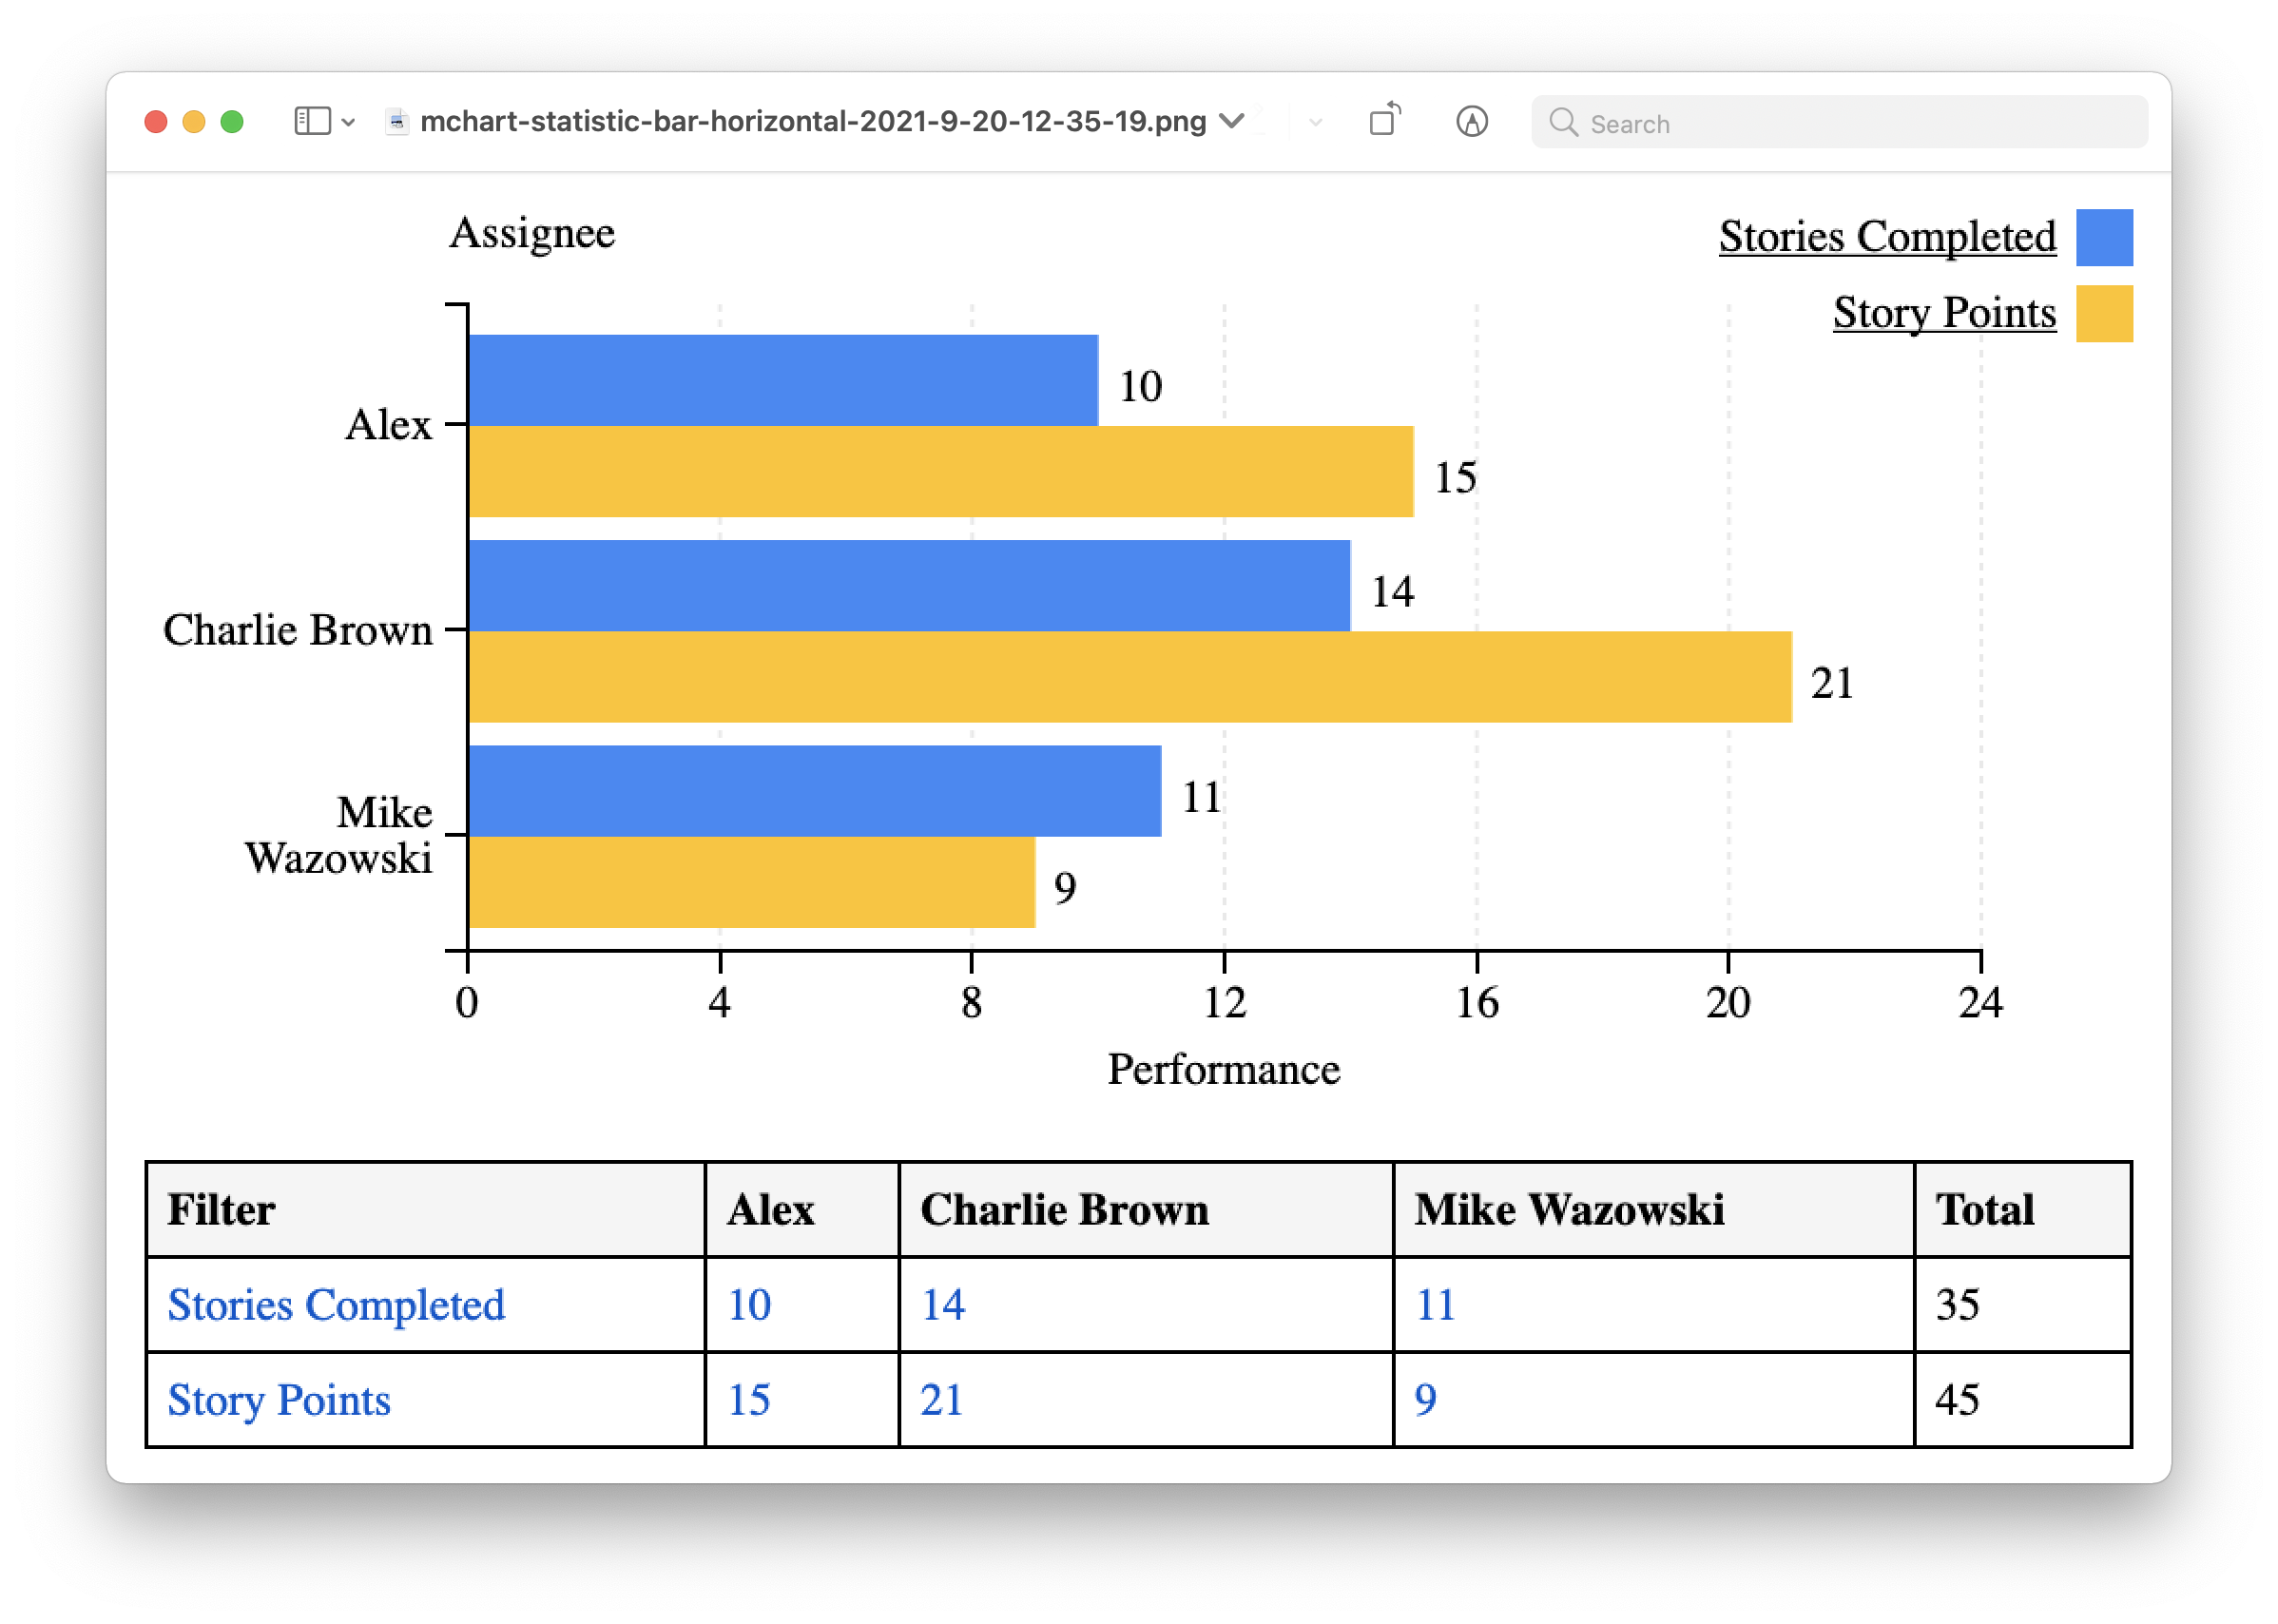
You can now export the chart and/or data table as PDF or PNG.
Refer to the supported browsers for exporting as PDF.
|
Options |
Sample PDF |
Sample PNG |
|---|---|---|
|
|
|
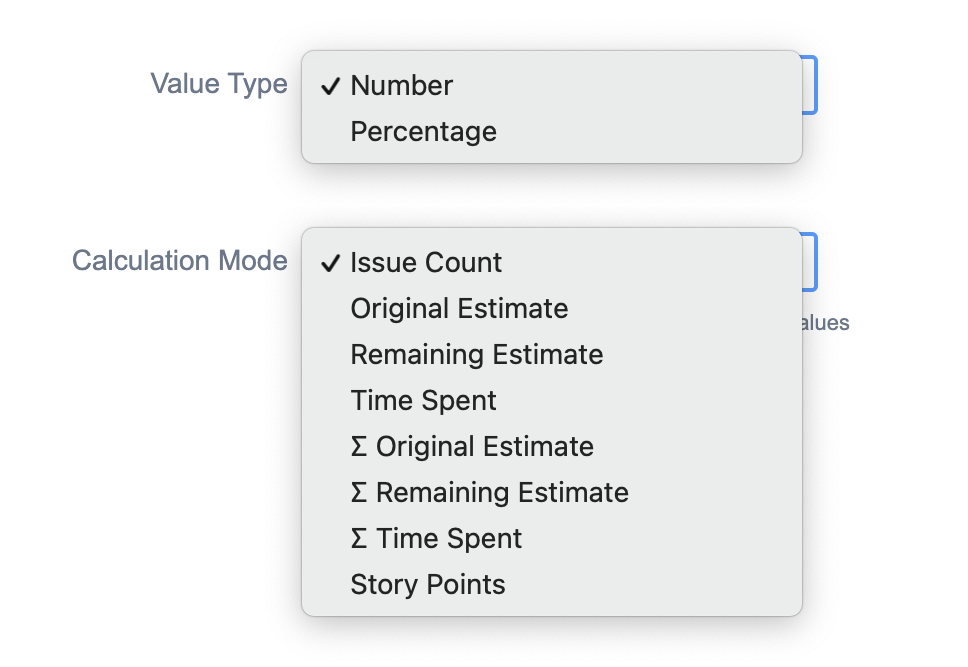
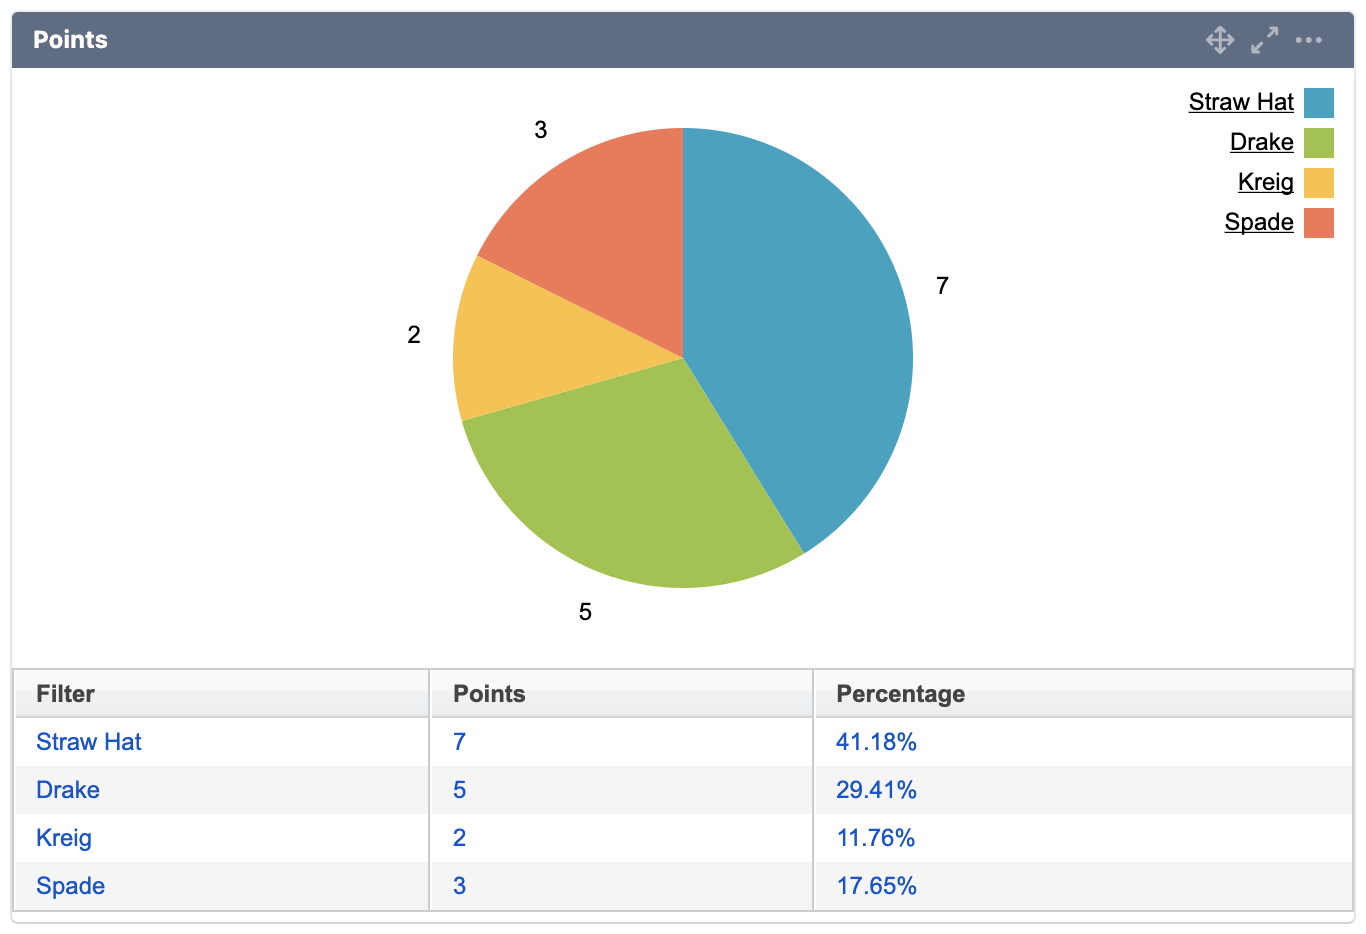
Support sum of number/time fields in pie chart
Updated the options for Value Type and added Calculation Mode.
|
Before |
After |
|---|---|

|
|
Filter value will not be included in the pie chart if the sum value is negative.
|
All filters with positive values |
One or more filters with negative values |
|---|---|
|
.png?cb=20c7fd84ed2363c4f9409a3a151fa2d0)
|
Support aggregate time fields
You can now plot charts using aggregate time fields:
-
∑ Original Estimate
-
∑ Remaining Estimate
-
∑ Time Spent
UI Improvements
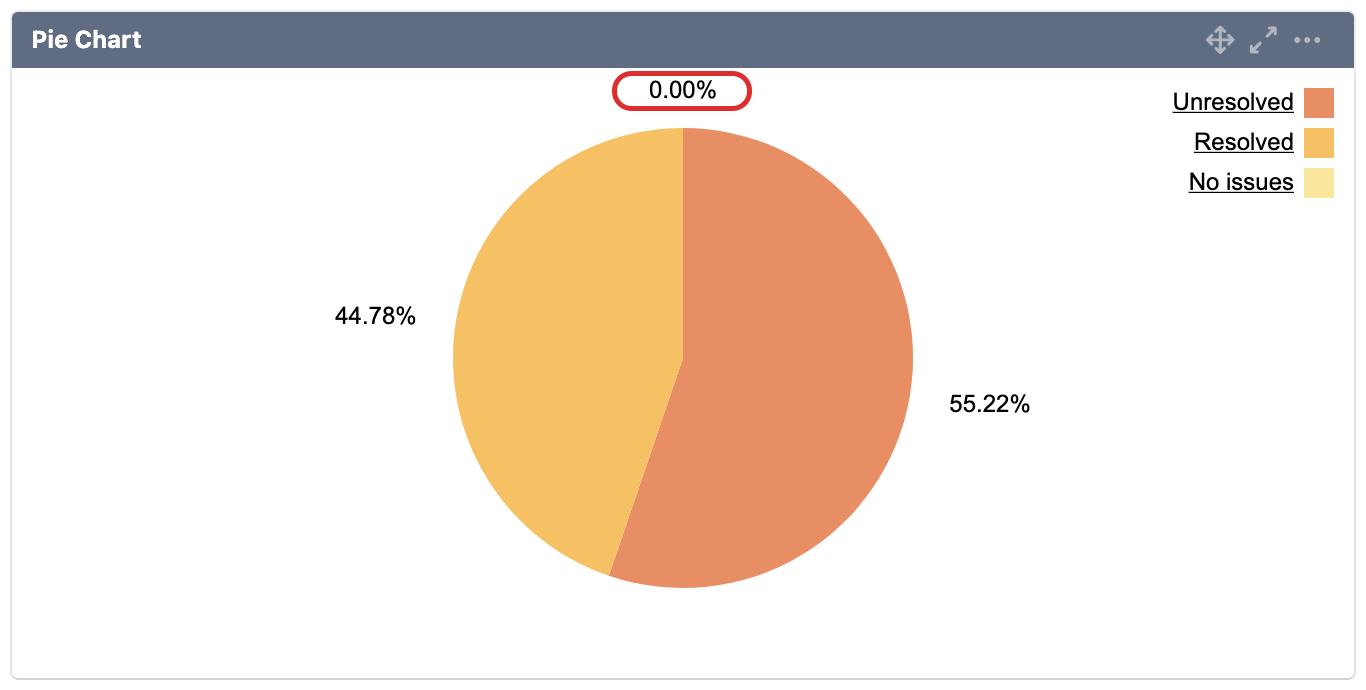
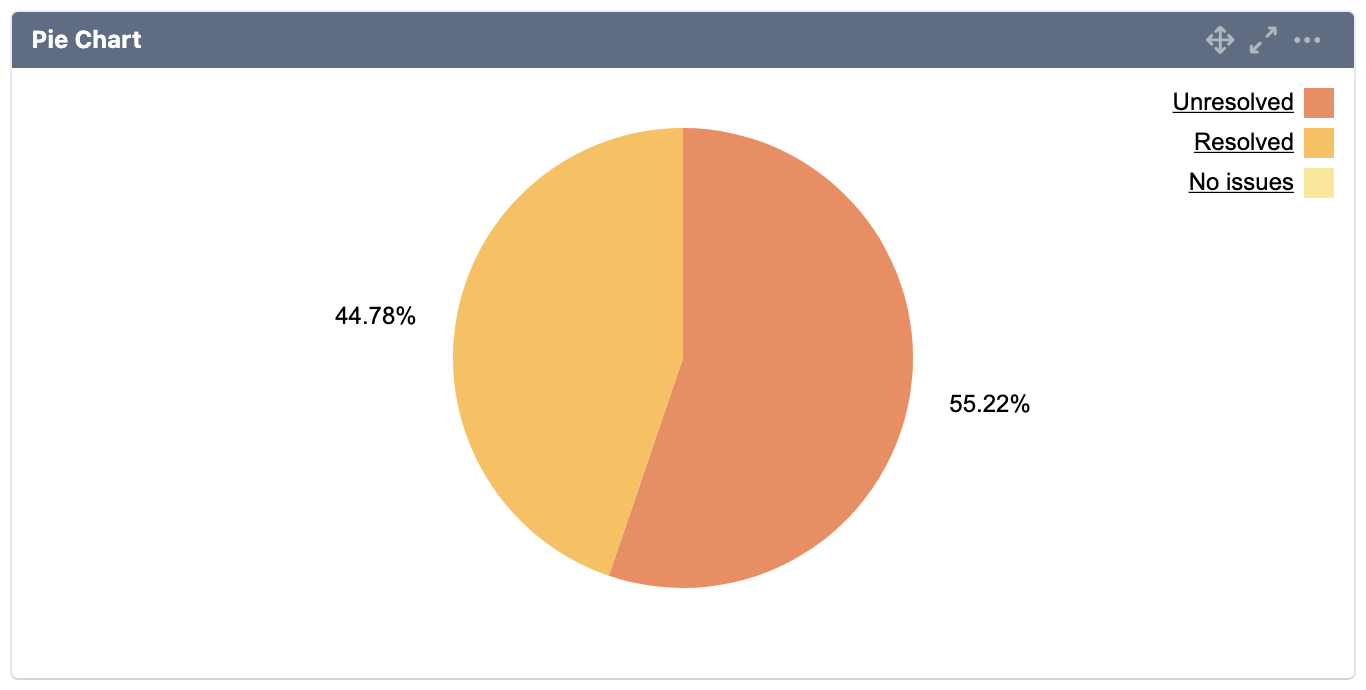
Hide 0.00% label in pie chart
The 0.00% labels in pie chart are now hidden.
|
Before |
After |
|---|---|
|
|
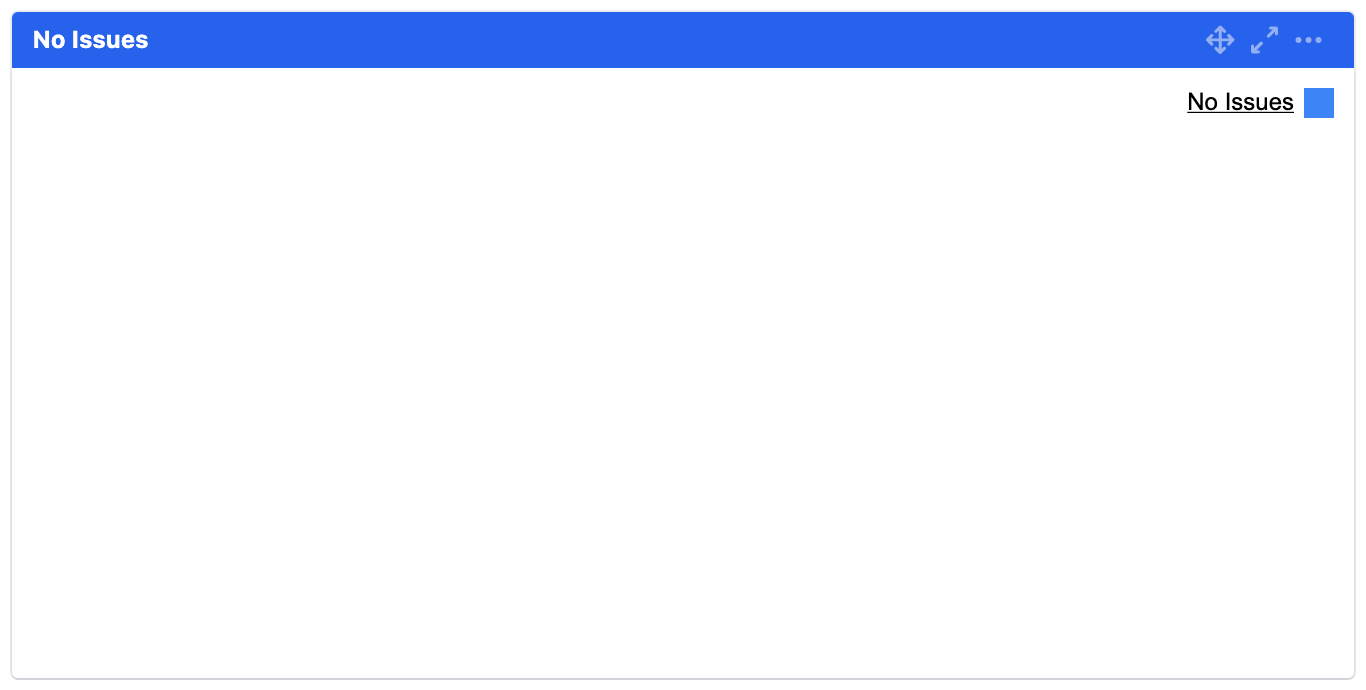
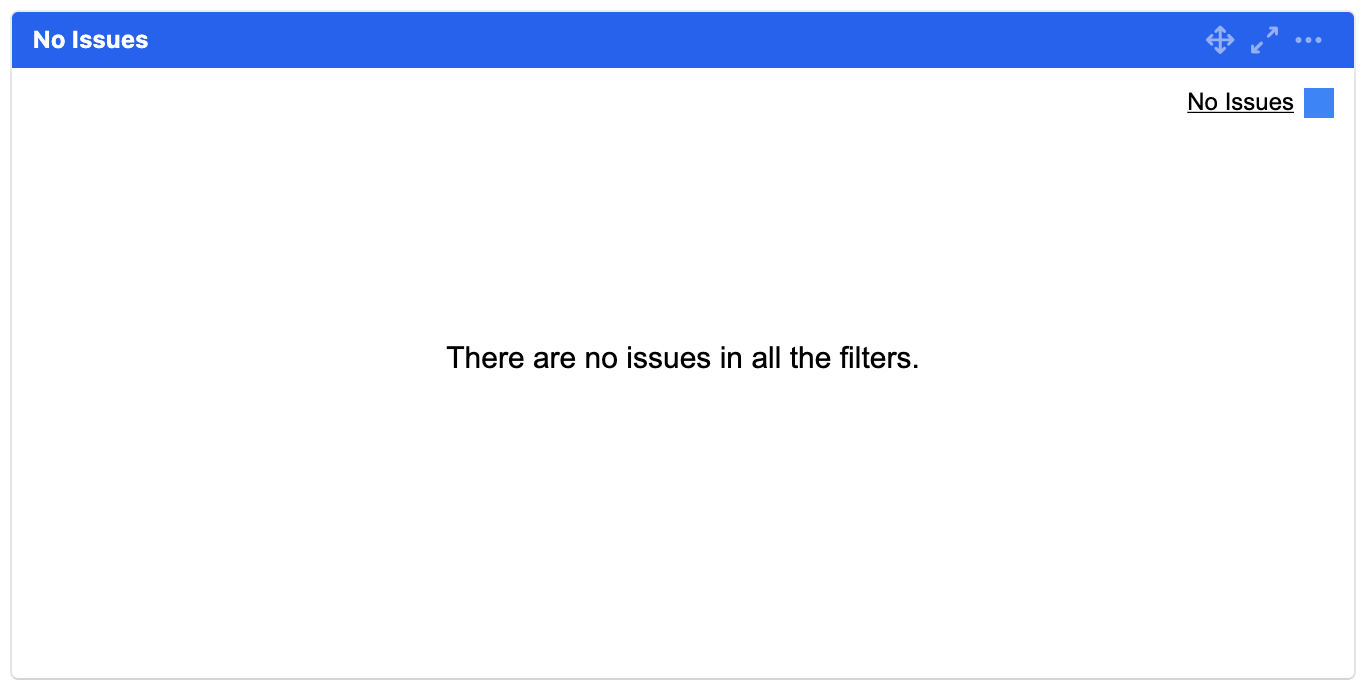
Display message if no issues/value
Message is displayed to notify users if there are no issues/value to plot the pie chart.
|
Before |
After |
|---|---|
|
|