Overview
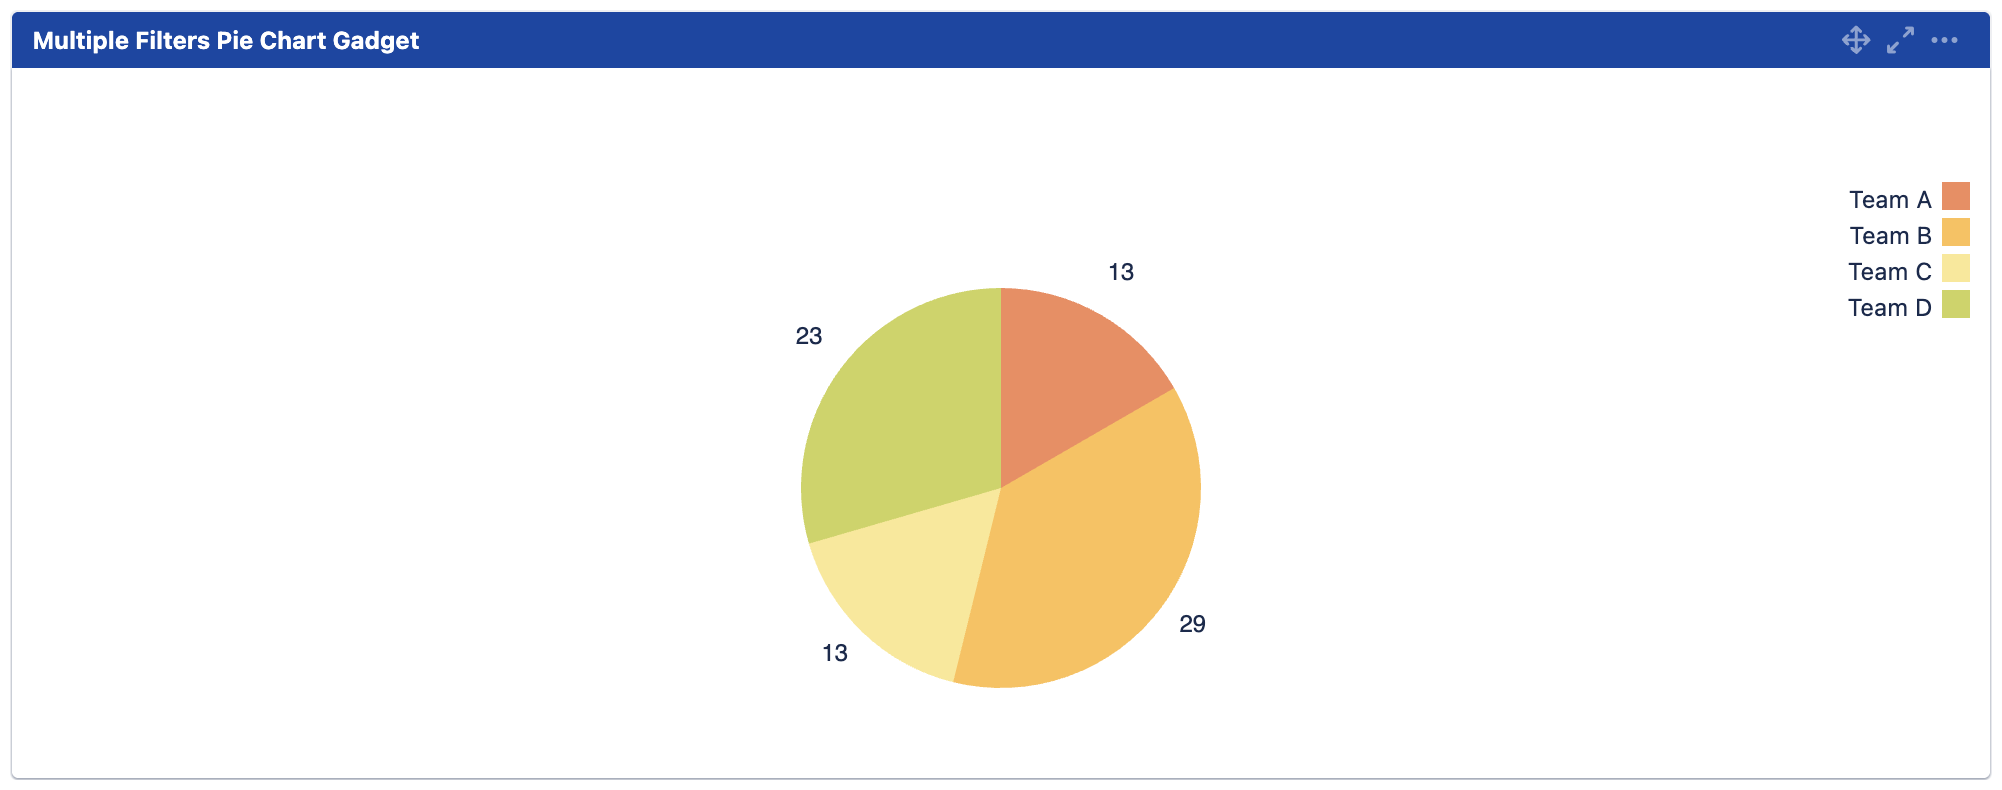
The Multiple Filters Pie Chart Gadget provides value/percentage reporting on issues.
Configuration
|
Settings |
Default |
Description |
|---|---|---|
|
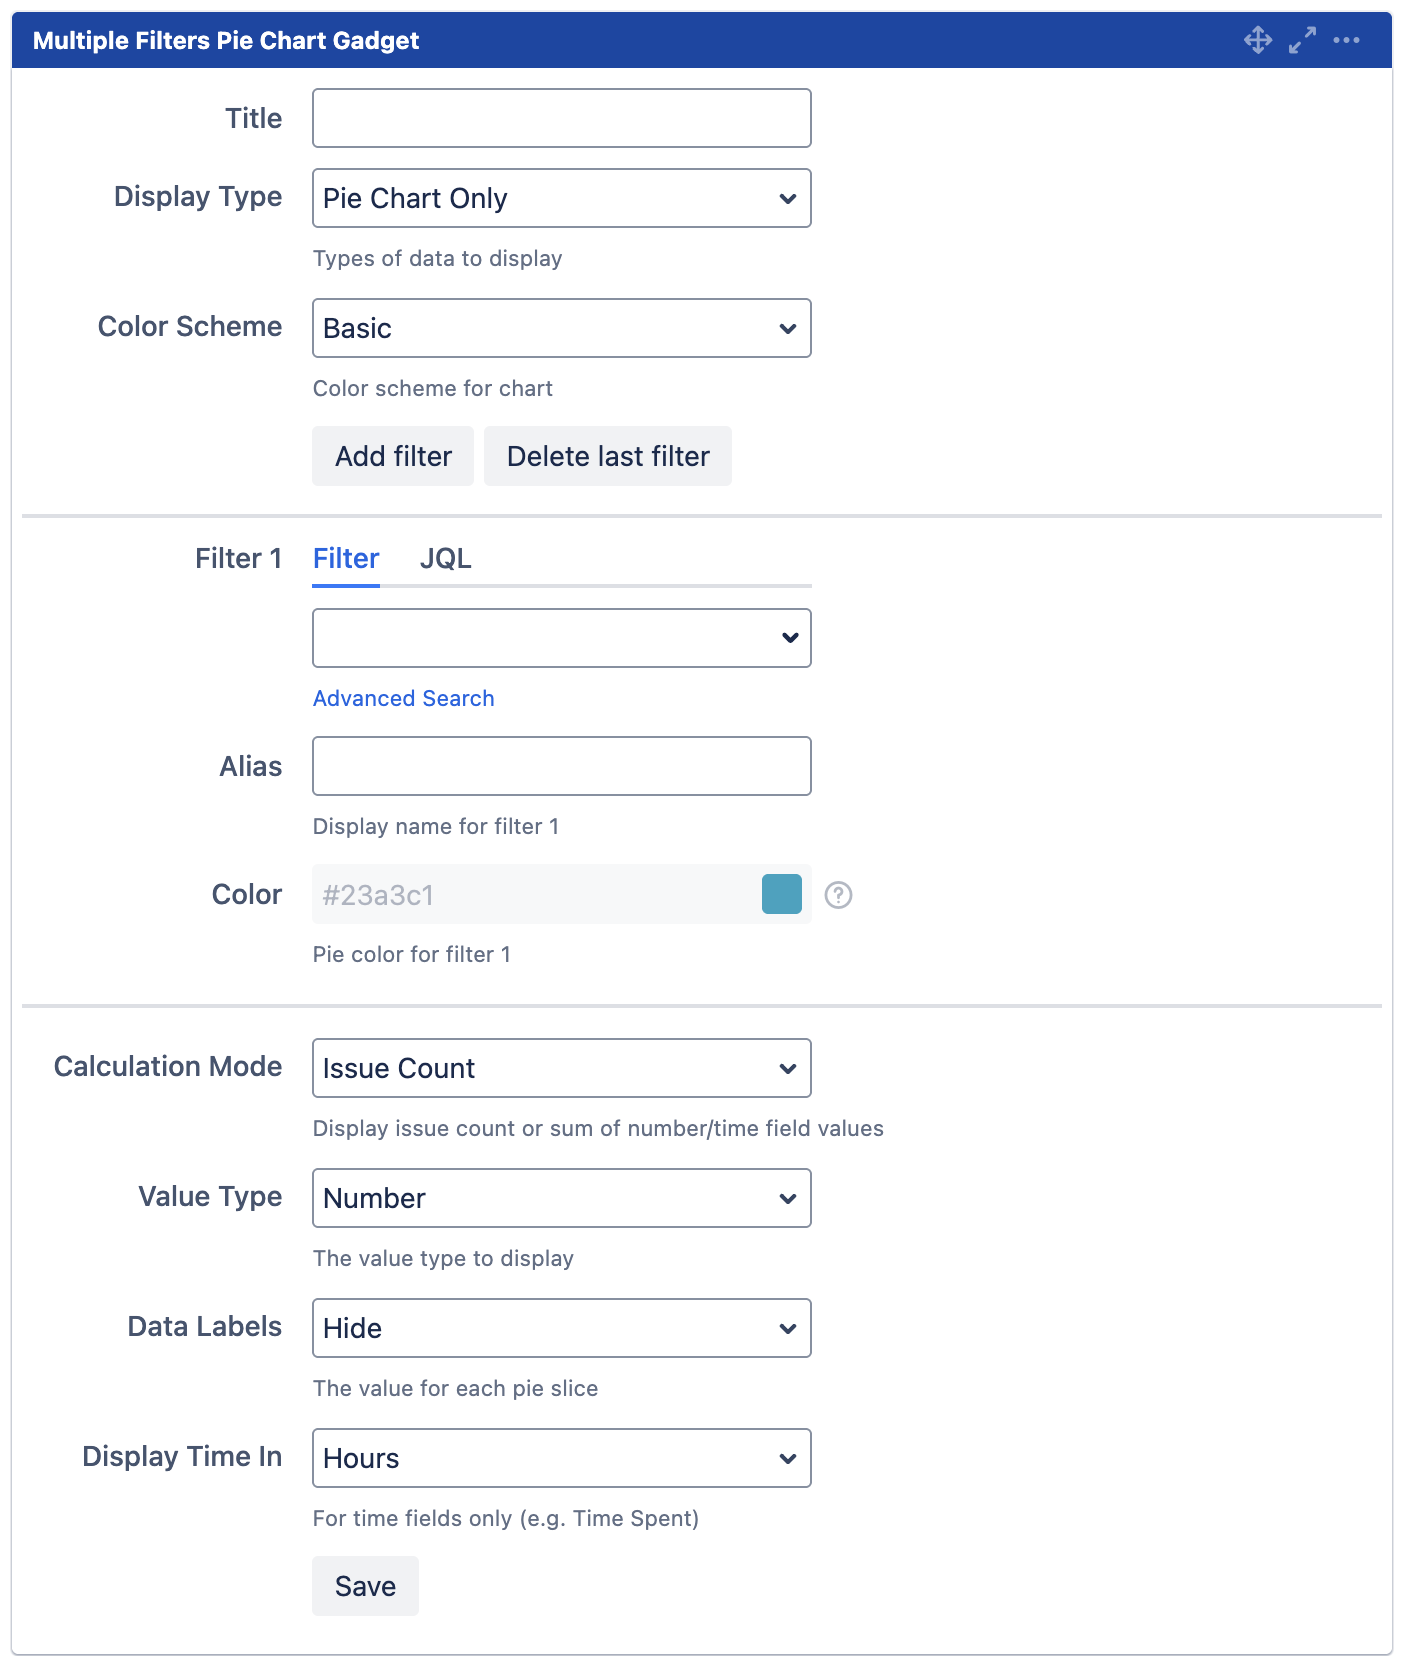
Title |
|
The title of the gadget |
|
Display Type |
Pie Chart Only |
The types of data to display:
|
|
Color Scheme |
Basic |
The color scheme for pie chart:
|
|
Add filter |
|
Click to add filter *Maximum of 12 filters |
|
Delete last filter |
|
Click to delete last filter |
|
|
||
|
Filter n |
|
Select filter or enter JQL |
|
Alias |
|
The display name for filter n |
|
Color |
|
The pie color for filter n *Configurable only if Color Scheme is set to Custom |
|
|
||
|
Calculation Mode |
Issue Count |
The calculation mode:
|
|
Value Type |
Number |
The value type to display:
|
|
Data Labels |
Hide |
Whether to show/hide the value for each pie slice:
|
|
Display Time In |
Hours |
The unit to display time in:
*Applicable for Time Fields only (e.g. Time Spent) |