This documentation is for Data Center/Server only. Click here for the Cloud documentation.
Multiple Filters Chart Gadget for Jira allows combining of multiple filters/JQL into a single chart for easy comparison.
10 gadgets available
📊 Bar Chart
🟡 Pie Chart
🔢 Counter
Key Features
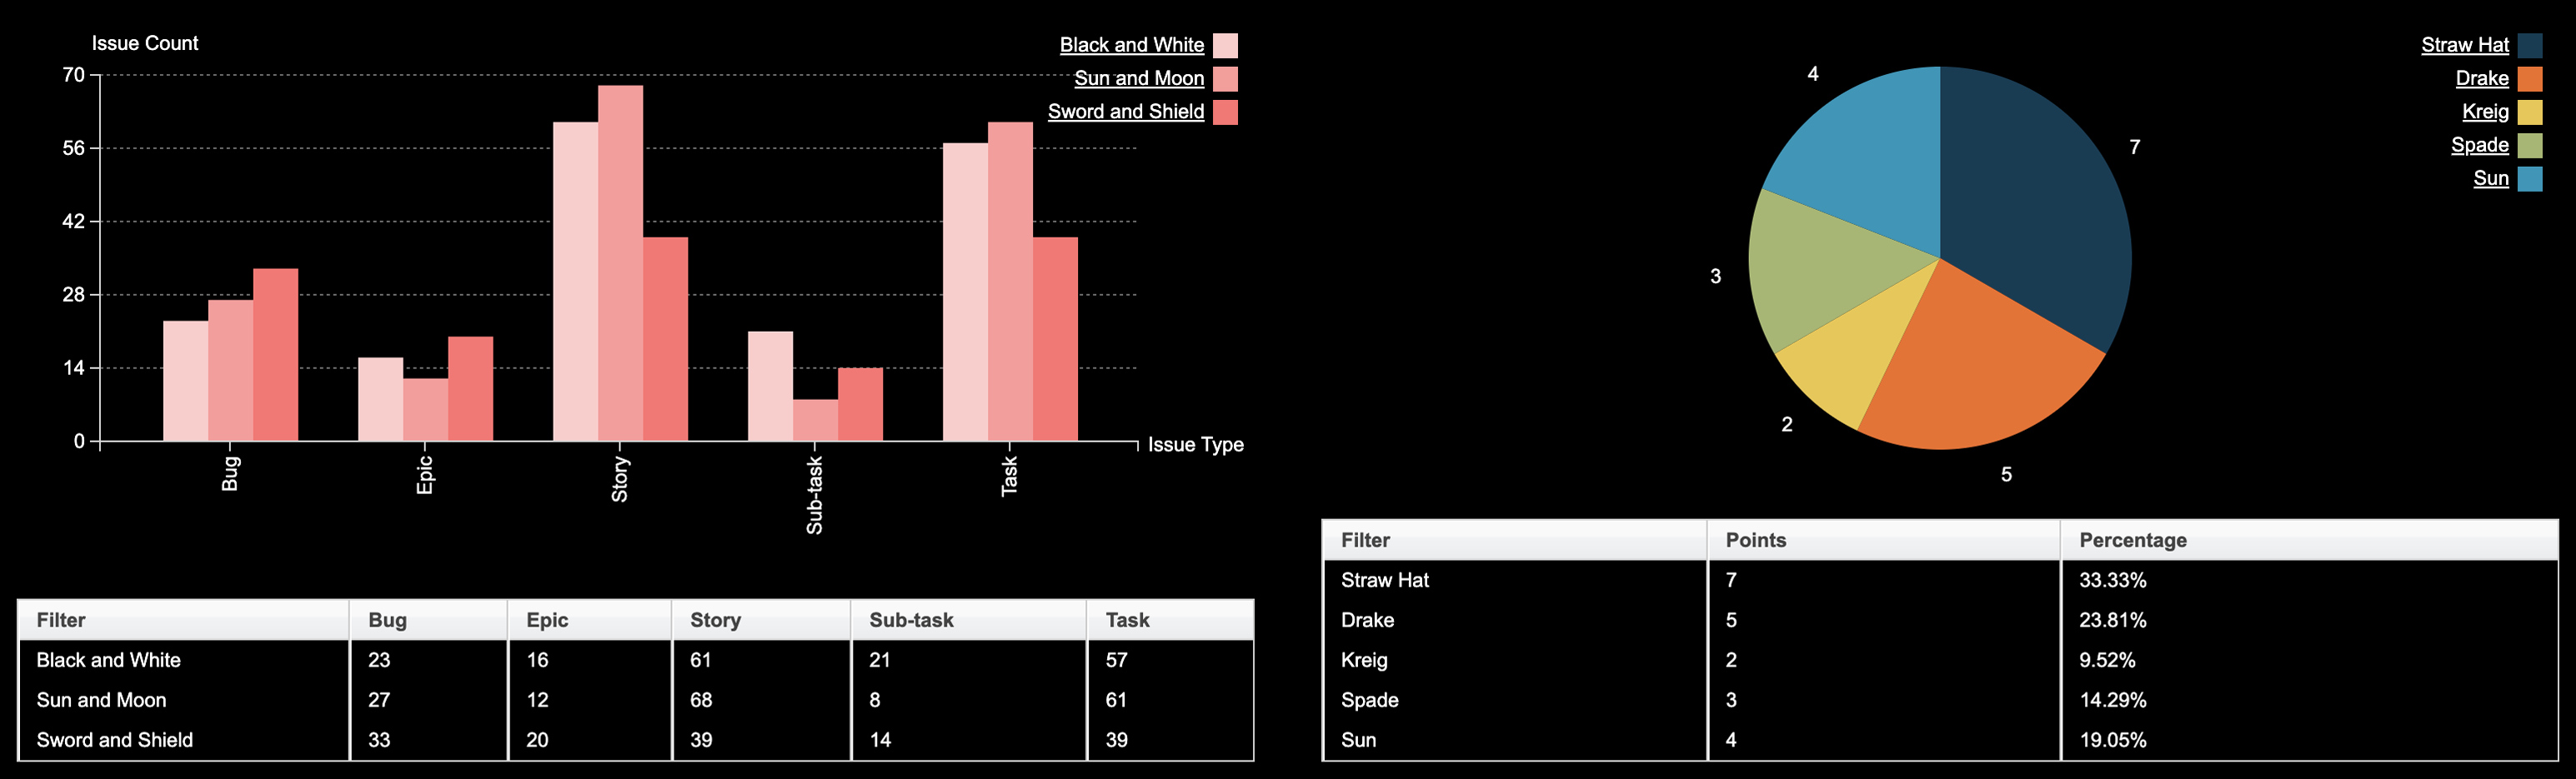
5 types of data visualisation
Visualise data with bar chart, line chart, pie chart, data table or counter board.
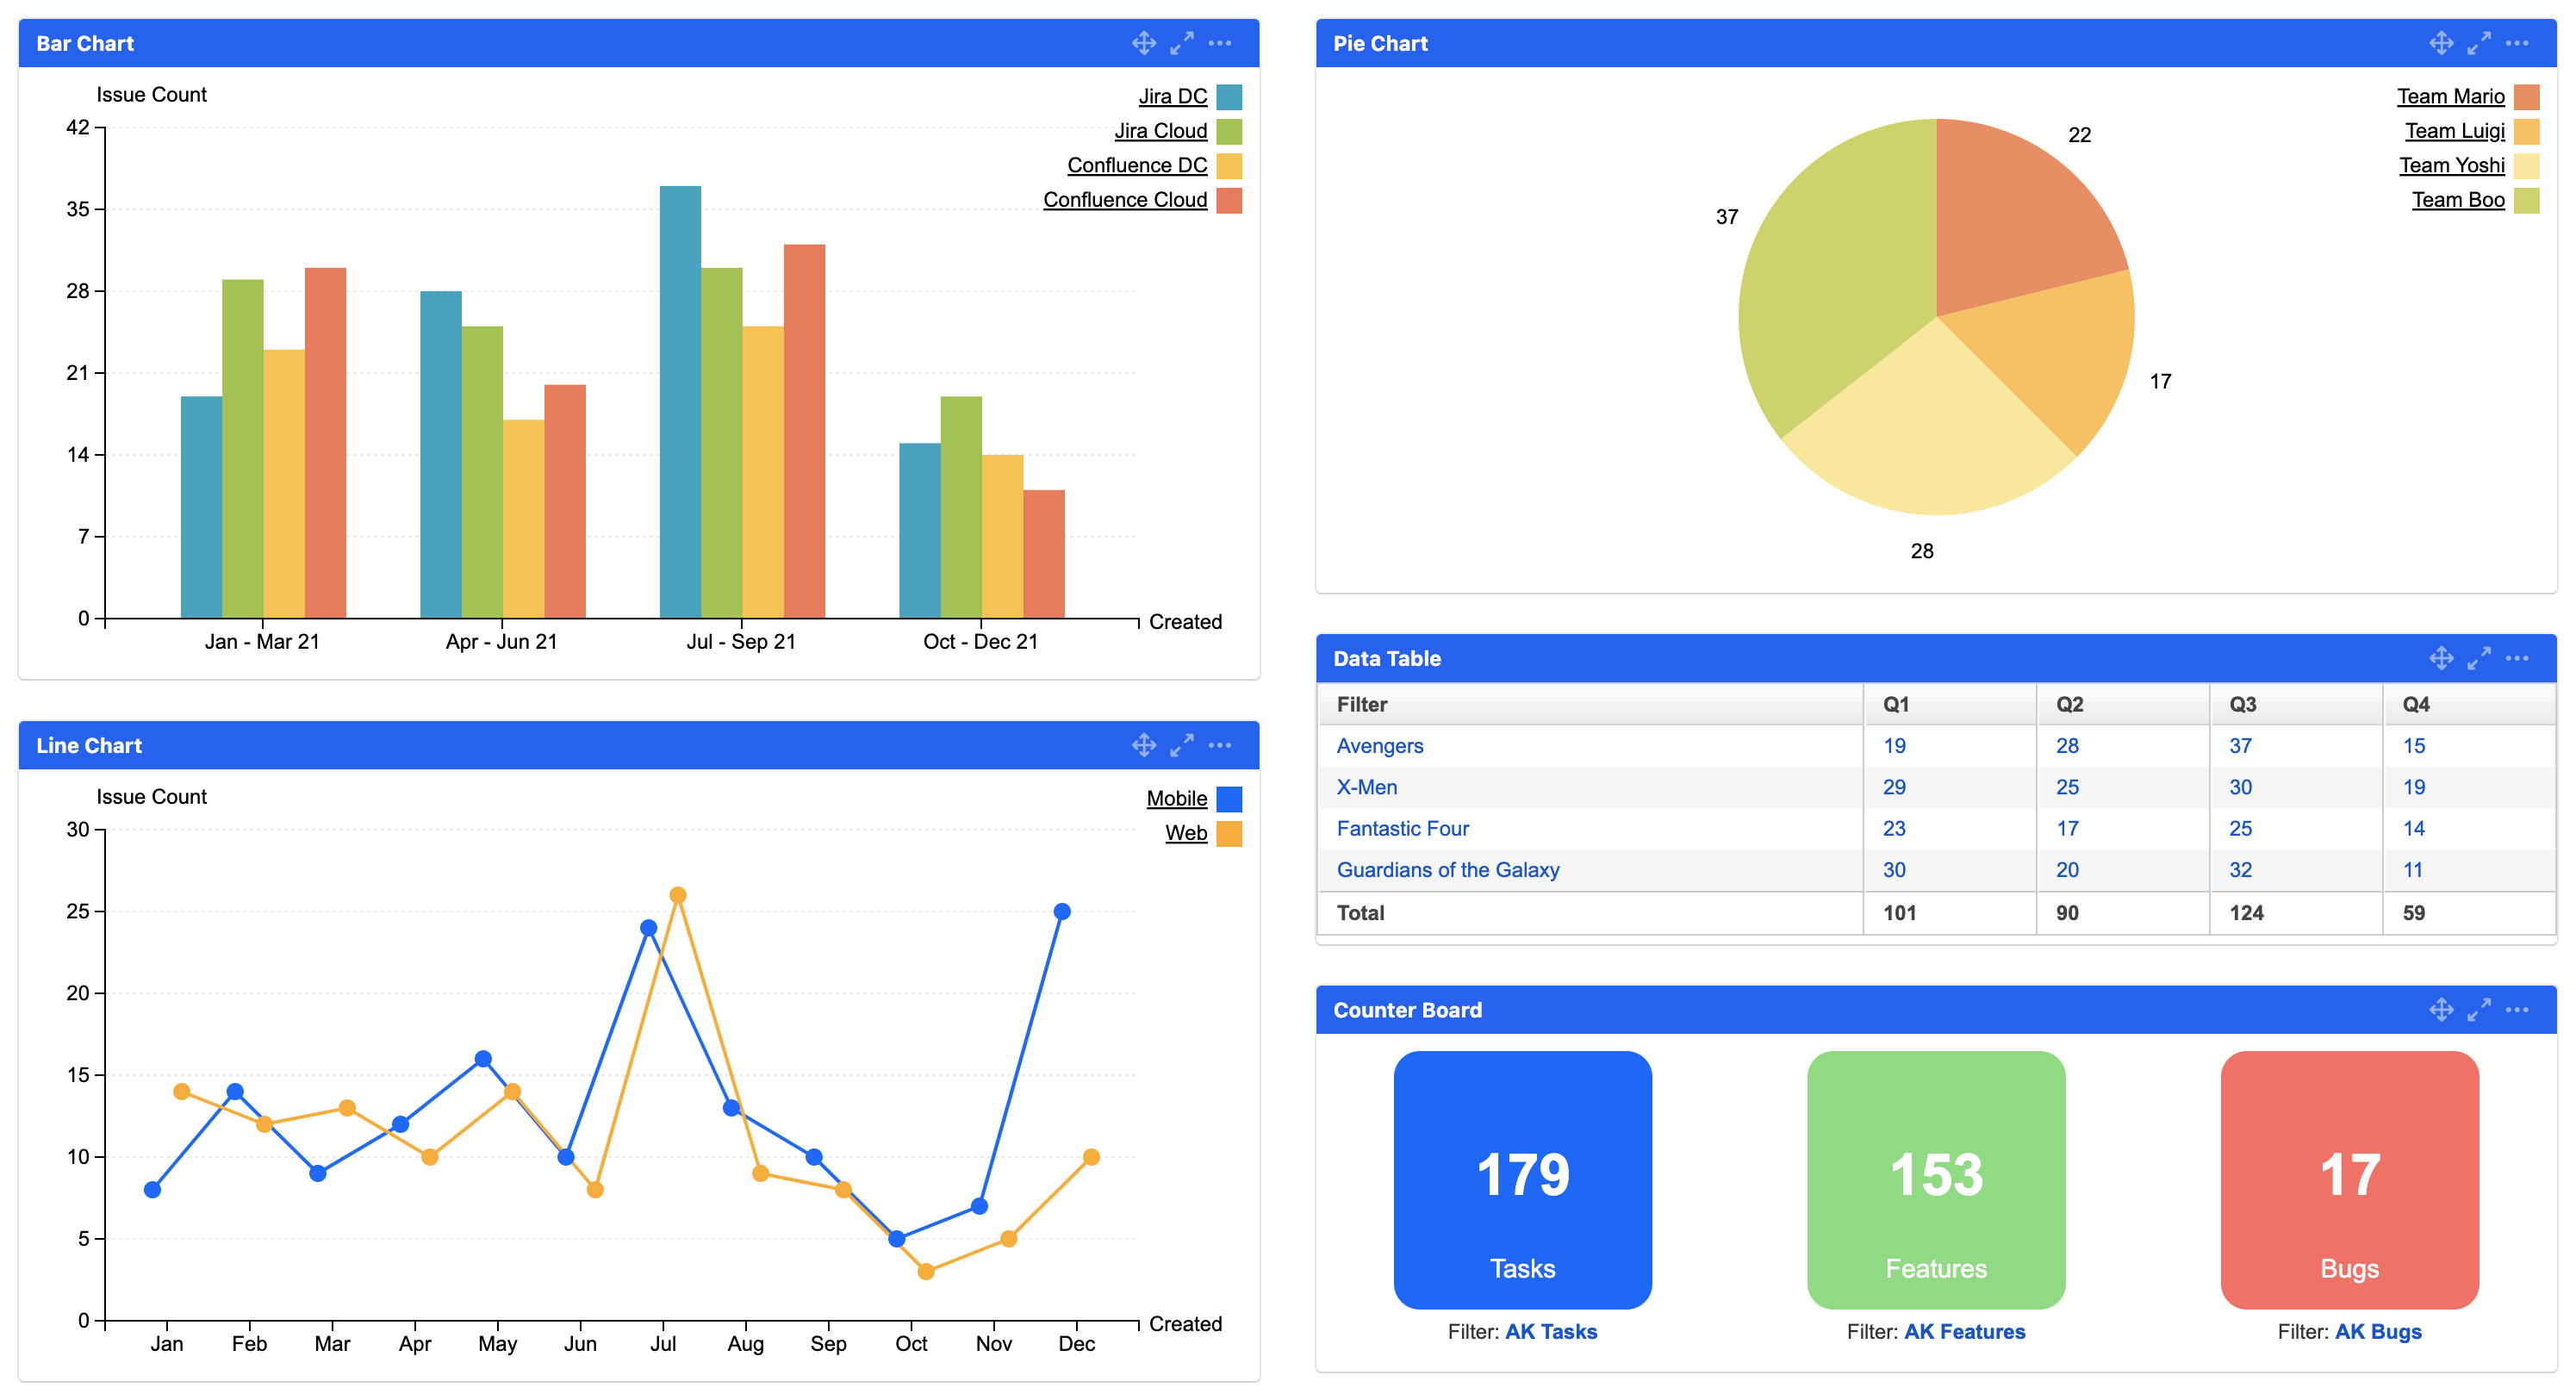
Combine multiple filters into one
Add up to 12 filters or JQL in a gadget. Choose to display chart only, data table only or both.
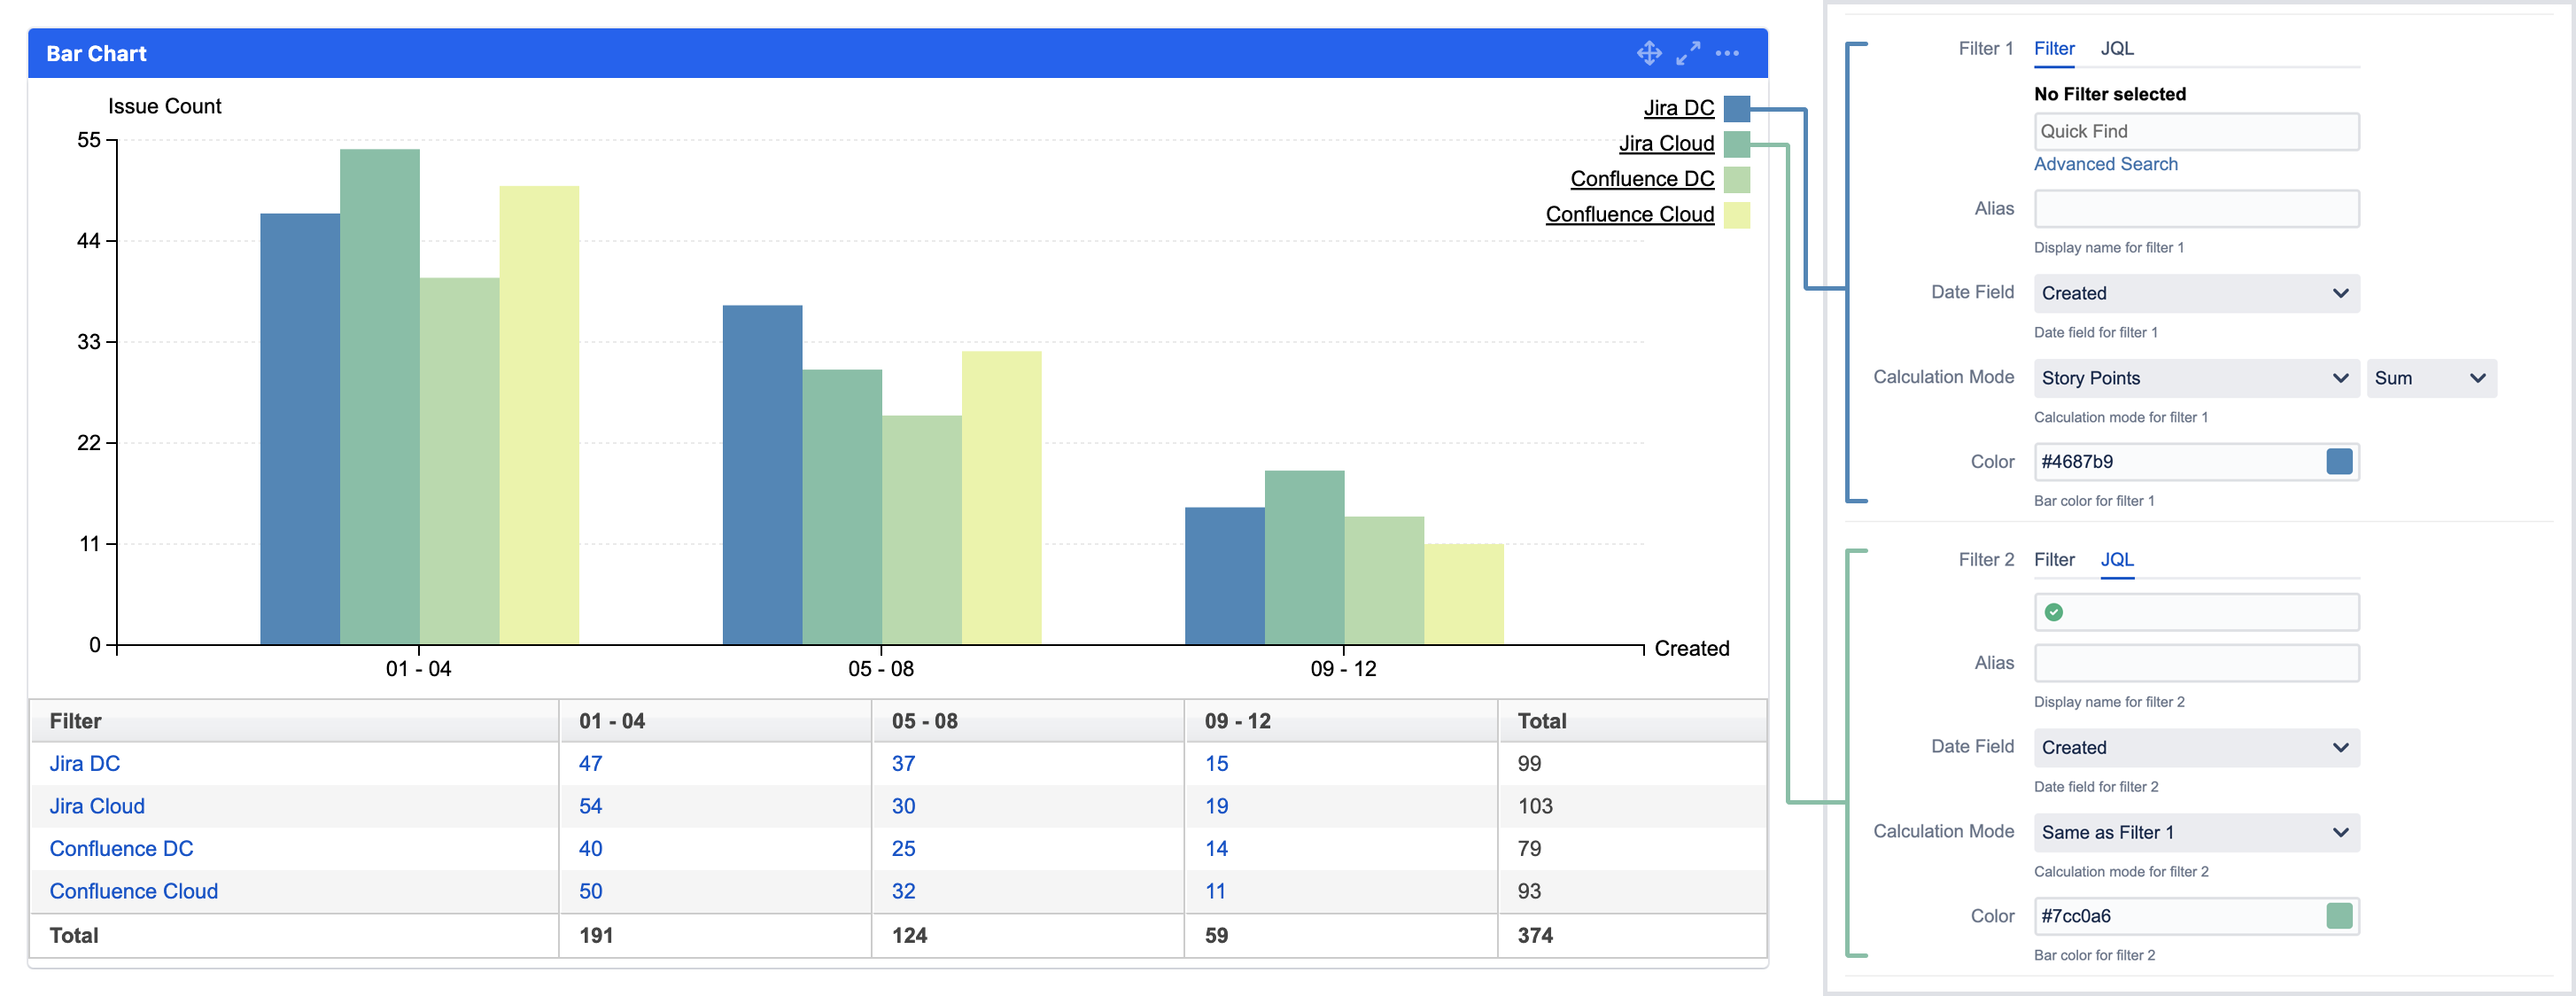
Various customisation options
Various options are available in each gadget for customisation.
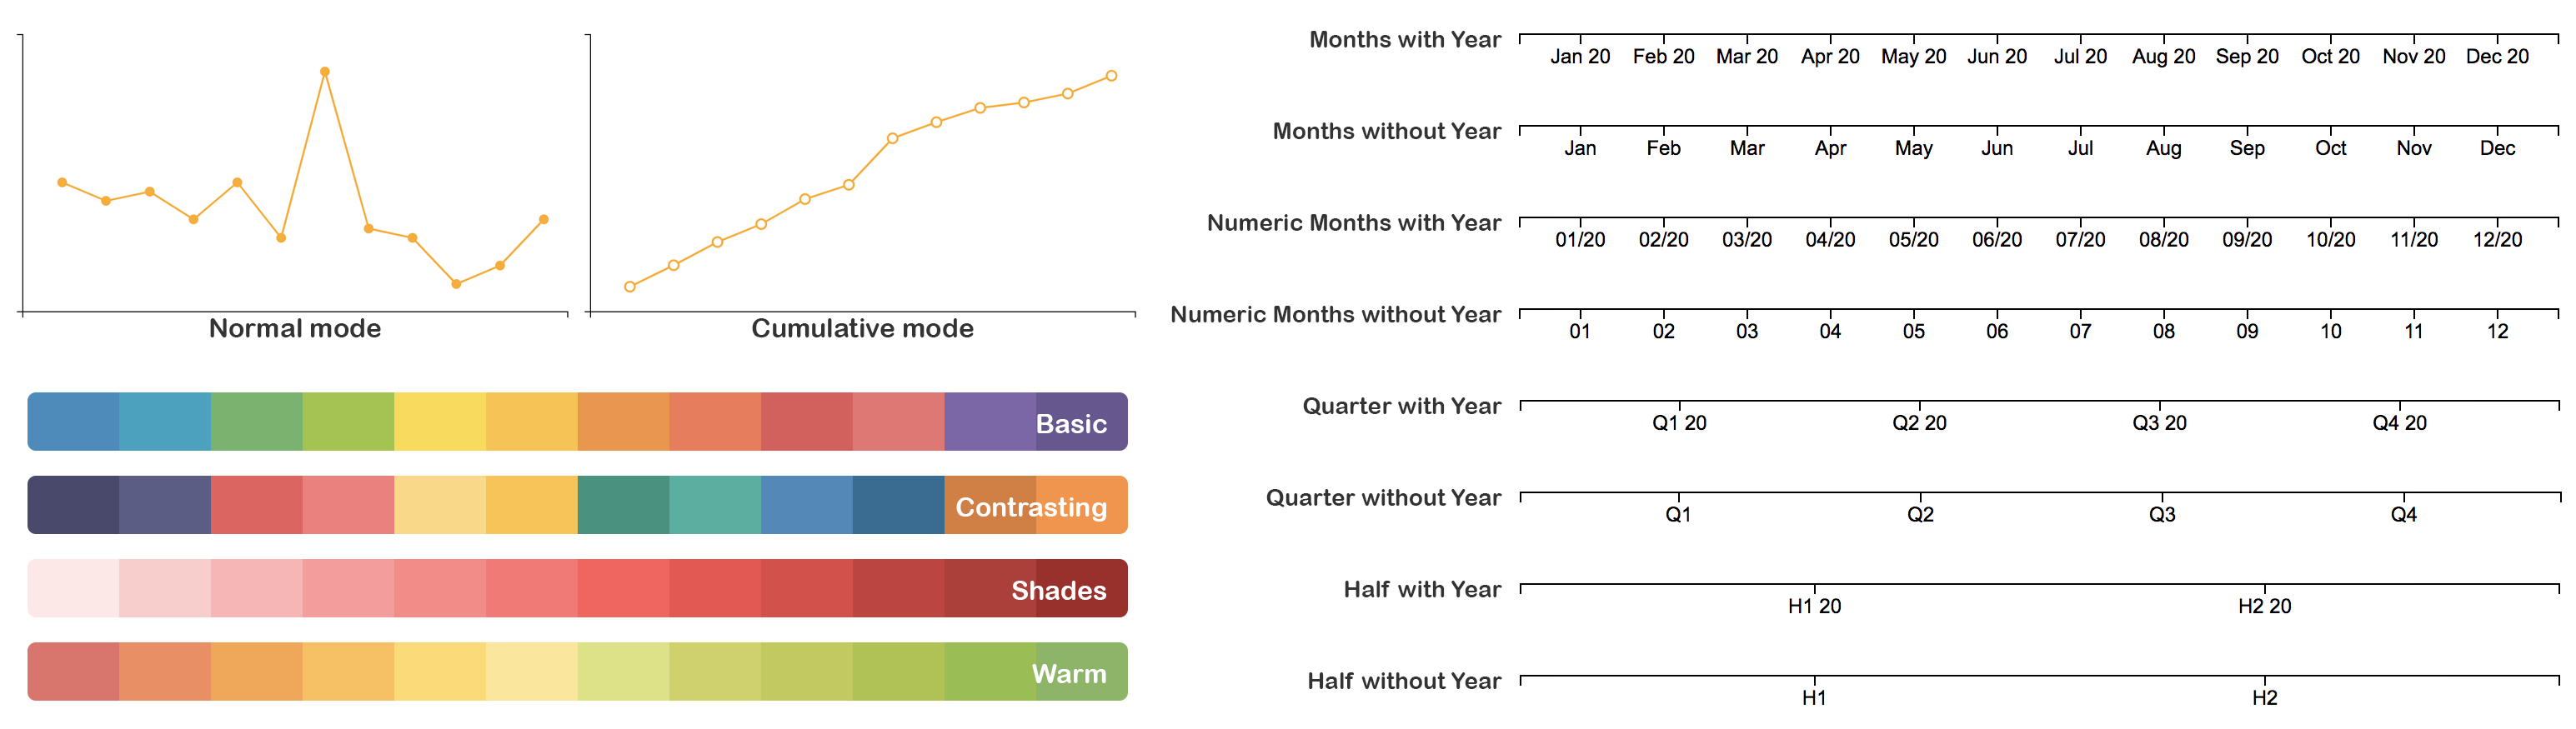
For example:
-
Display chart in normal or cumulative mode
-
Choose from the 4 predefined color schemes or customise your own
-
Select your preferred period format
Supports wallboard mode
Charts can be viewed in wallboard mode too!