Improvements
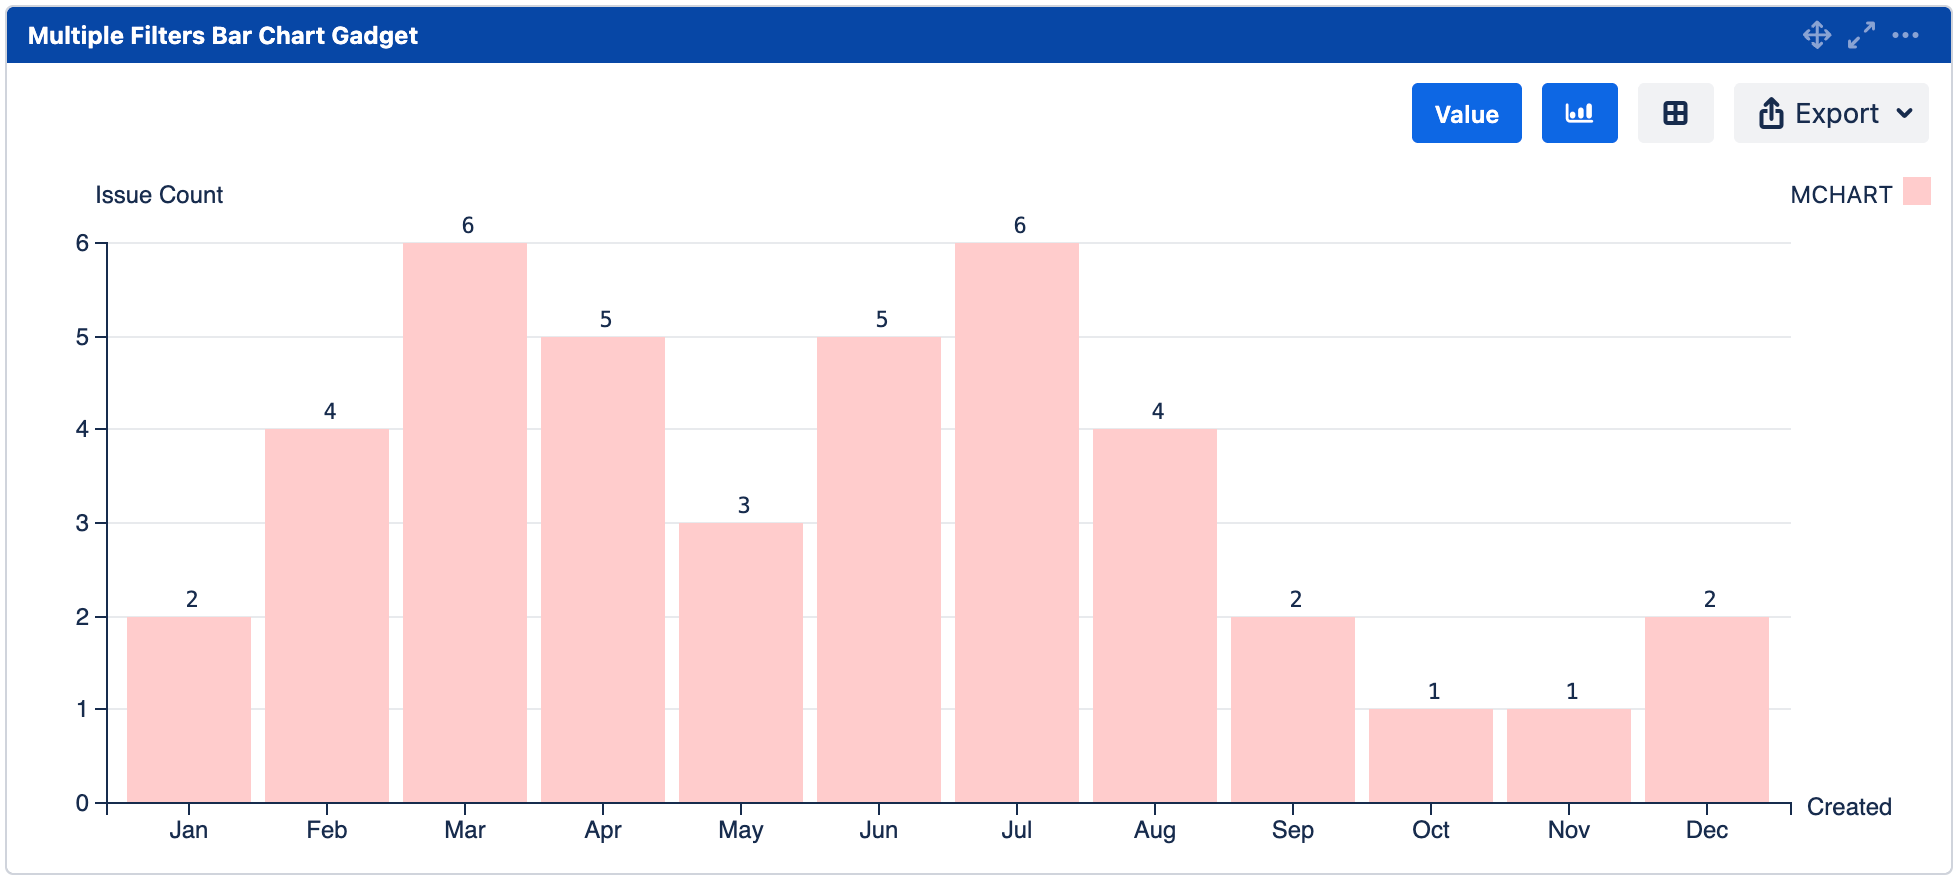
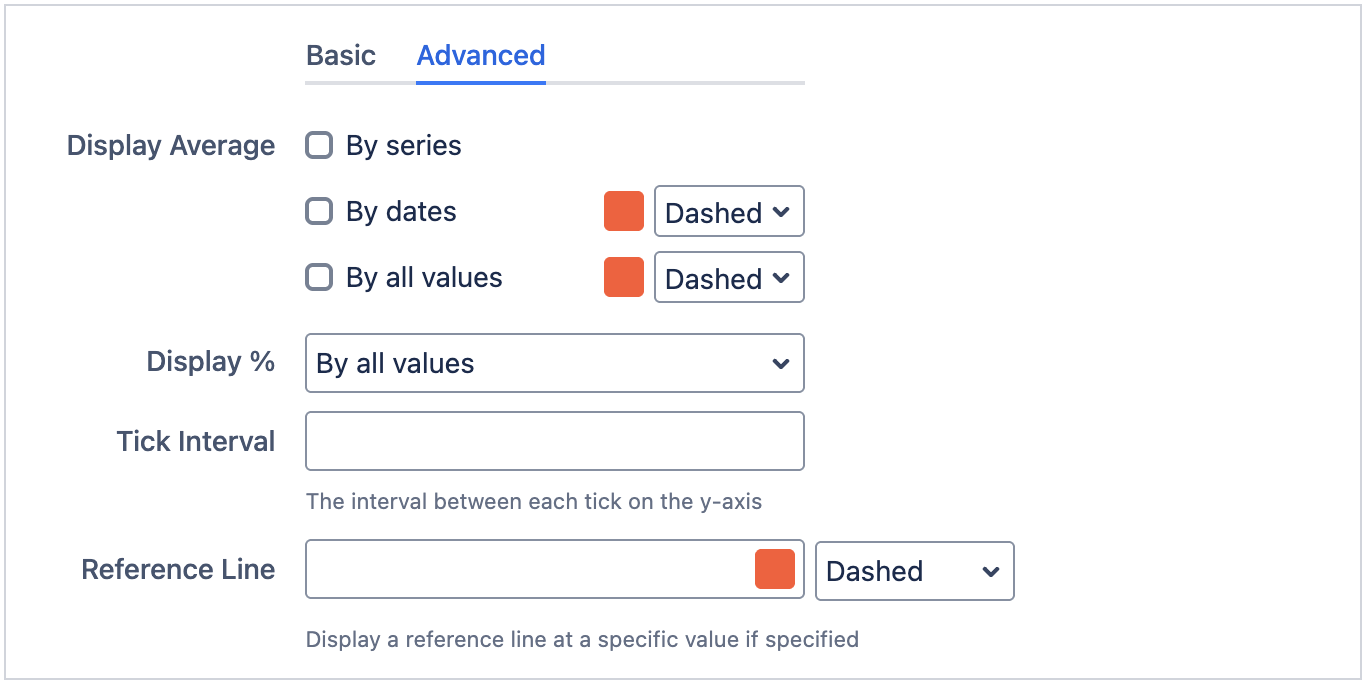
Display Average
This is only available in Multiple Filters Bar Chart Gadget.
This allow users to display average values by series, dates and all values.
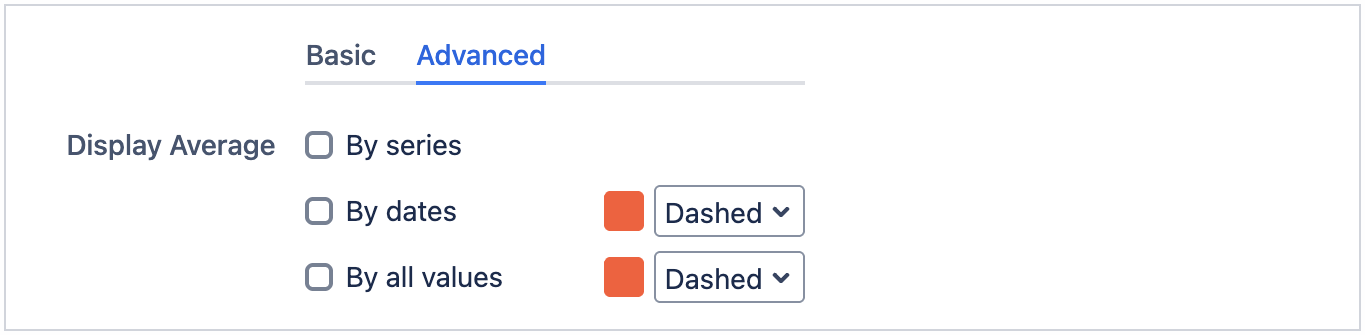
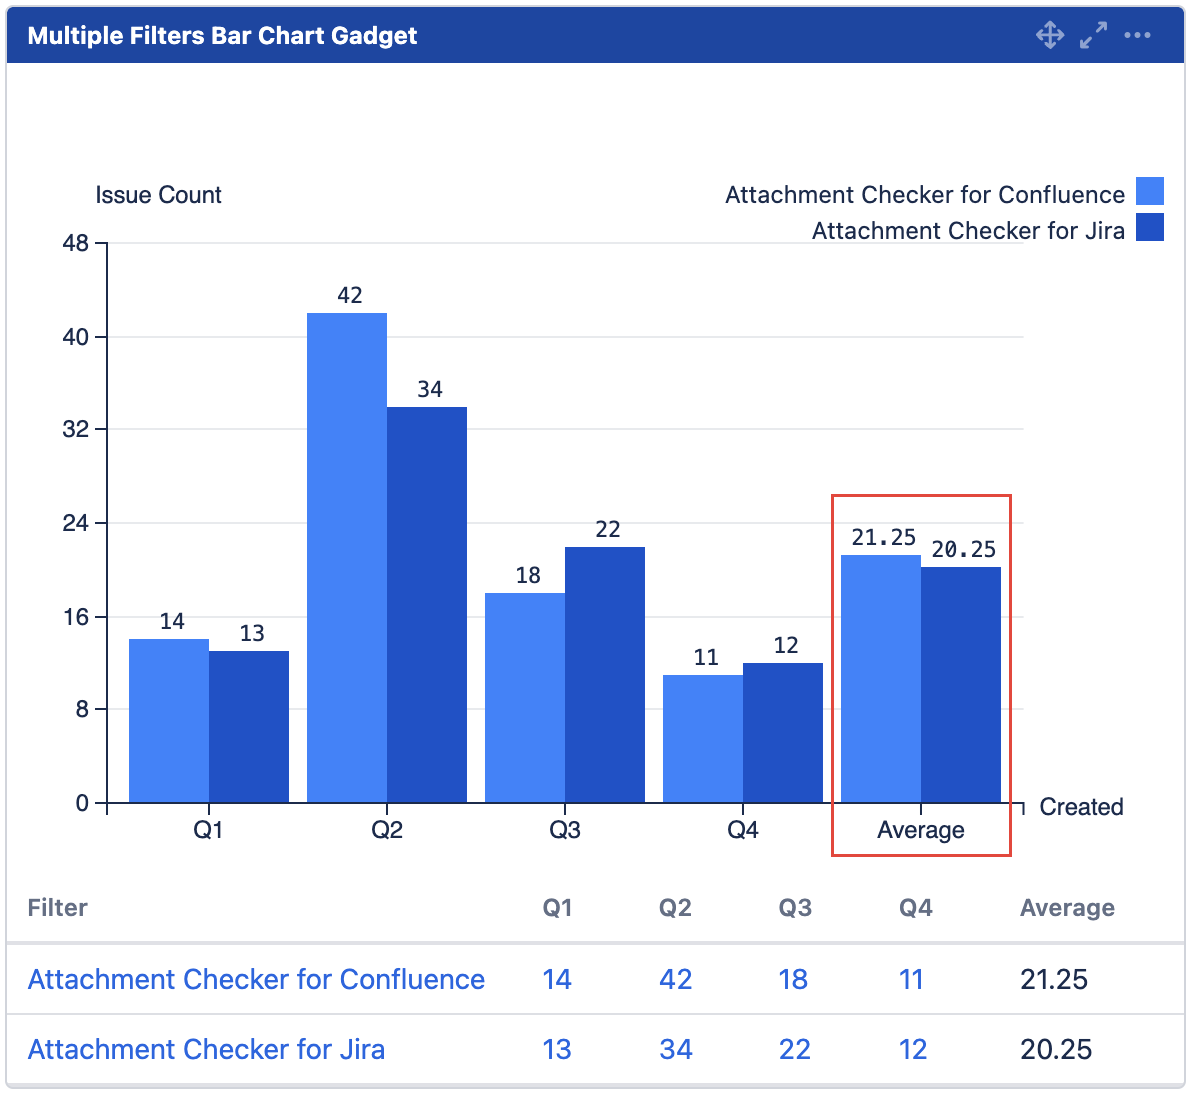
By series
Displays additional set of bars at the end (right) to represent the average values for each series.
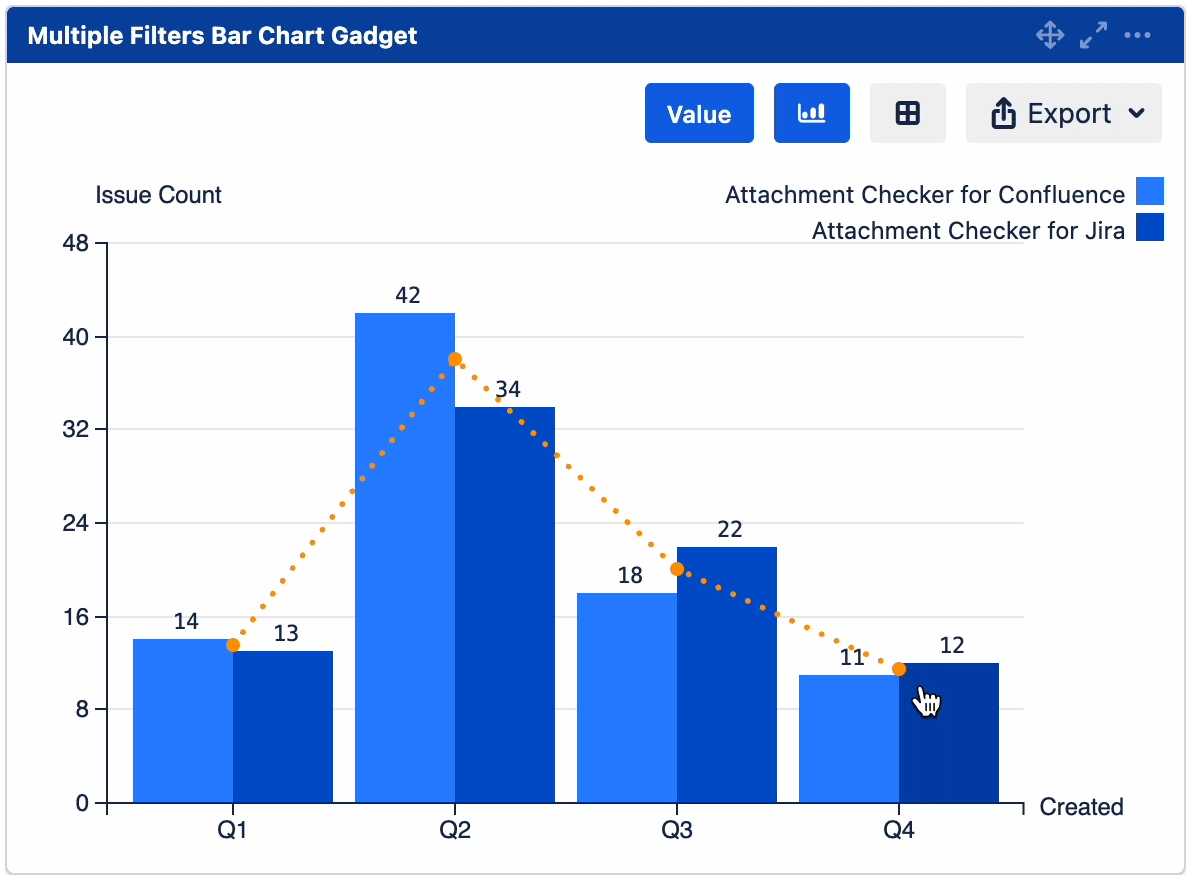
By dates
Displays a line with points at each date label to represent the average values for each date.
Hover over each point to reveal the average value.
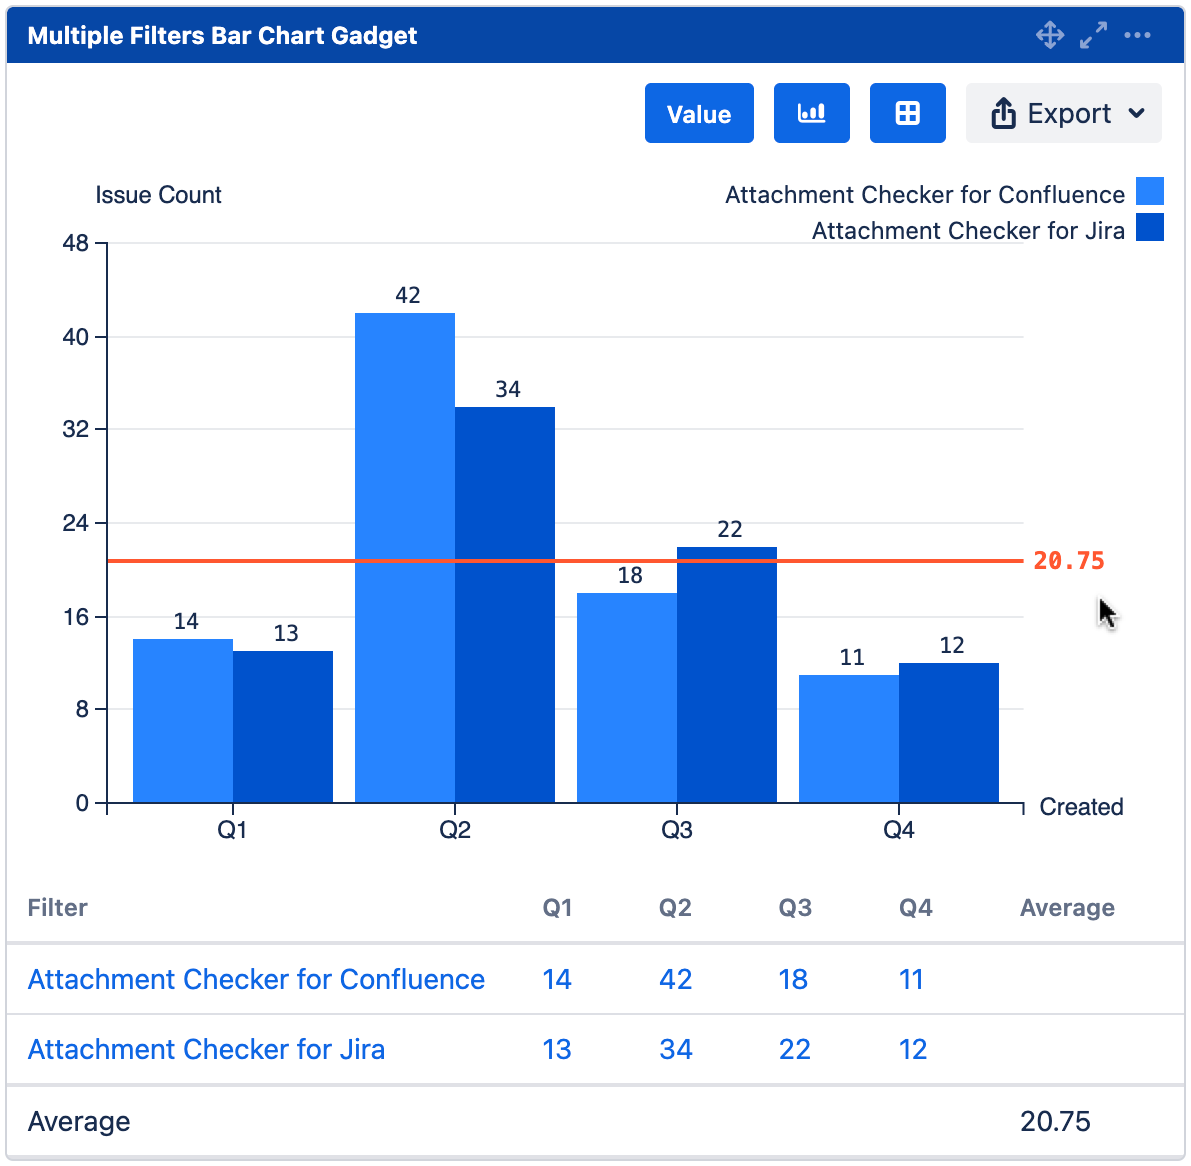
By all values
Displays a horizontal average line in the chart.
Hover over the gadget to reveal the average value.
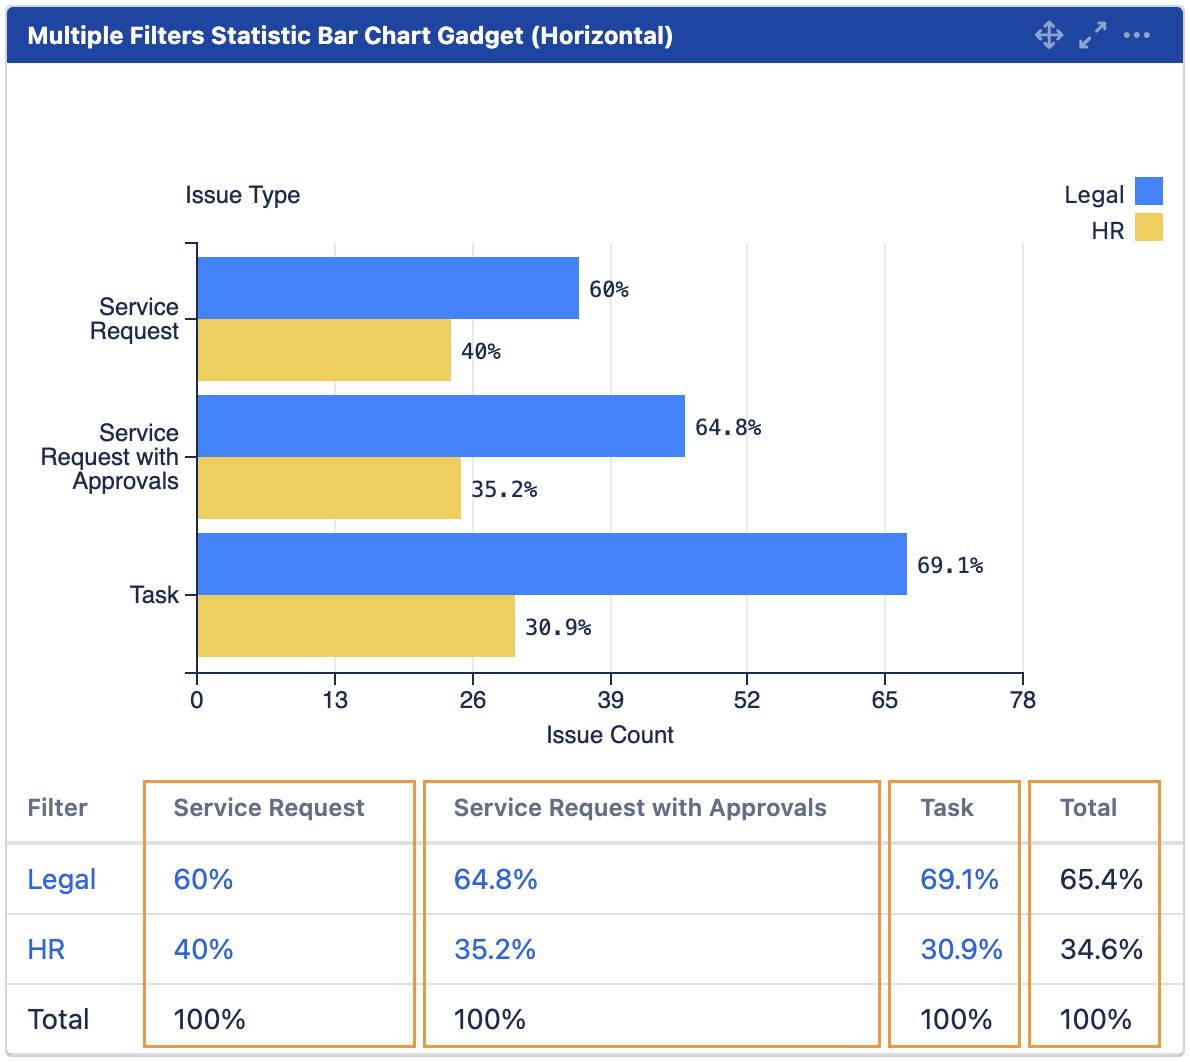
Display %
This is available in all bar and line chart gadgets.
This allow users to display % values by series, dates/statistic types and all values.

By series
% of value from the same series
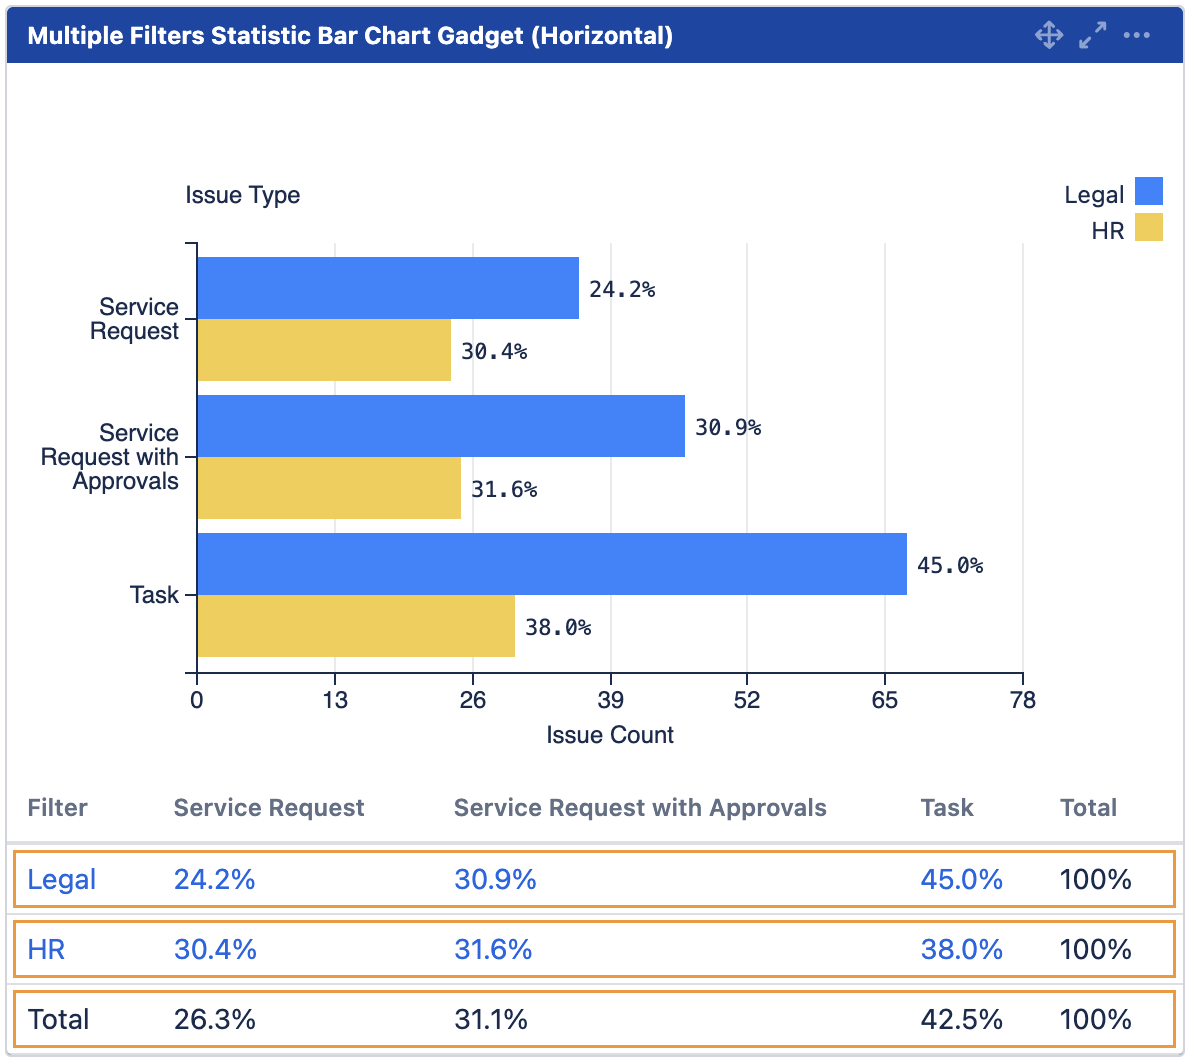
By dates/statistic types
% of value from the same date/statistic label
By all values
% of value against total value
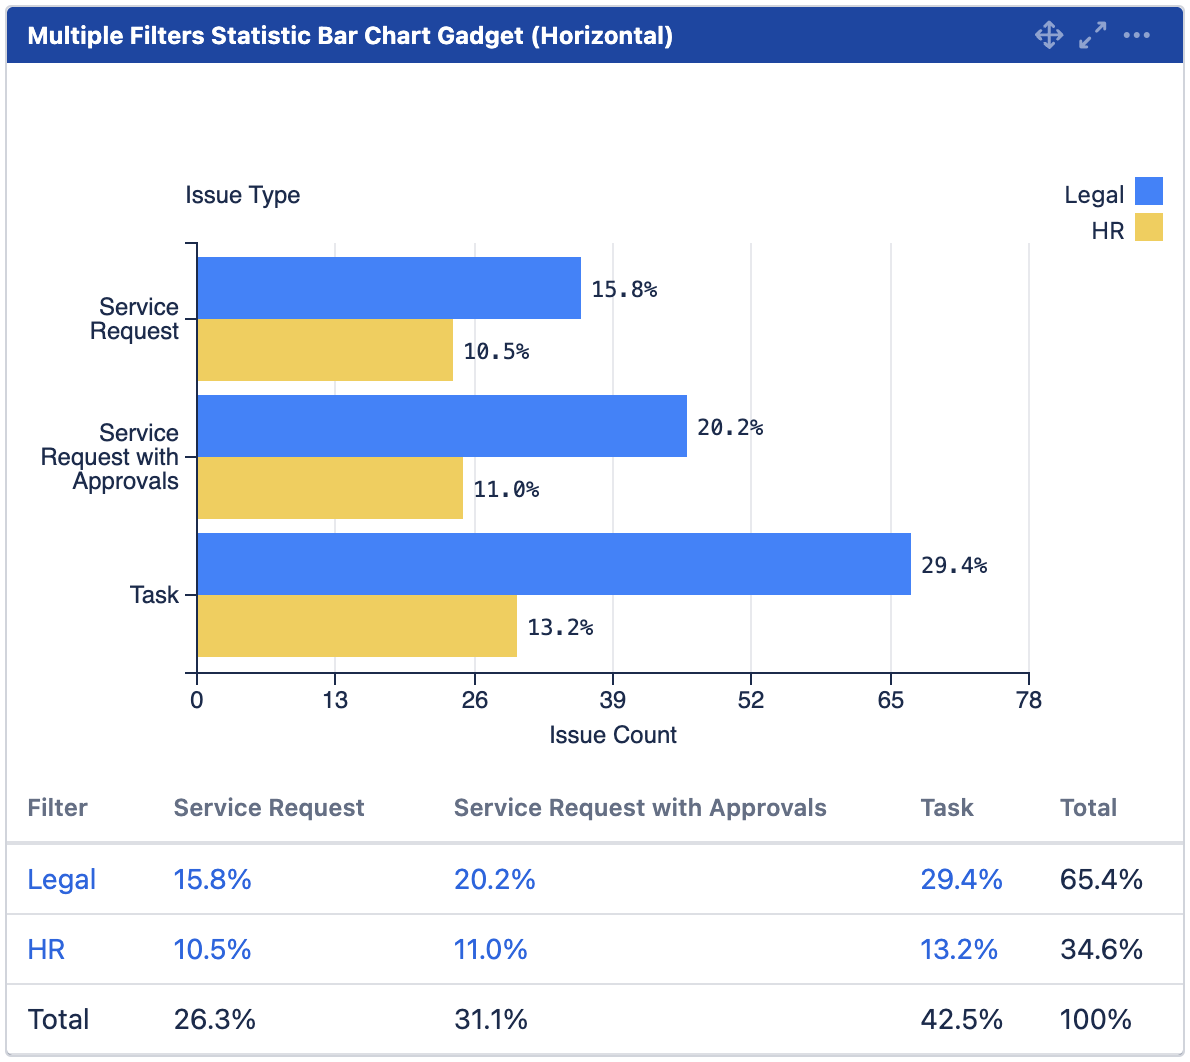
Please note that the total percentage may not add up to 100% due to rounding issues.
Data Labels
The options in Data Labels setting has been updated.
|
Before |
After |
|---|---|
|
|
An interactive button is also available for users to toggle the displayed value.
UI updates
The settings after the filters have been split into Basic and Advanced tabs.
The following settings are placed under the Advanced tab:
-
Display Average
-
Display %
-
Tick Interval
-
Reference Line
Work items resolved
|
Type |
Key |
Summary |
|---|---|---|
|
Improvement |
To display average line |
|
|
Improvement |
To display % value |