Summary
New Features
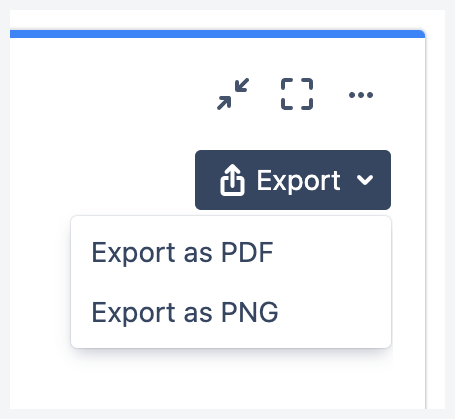
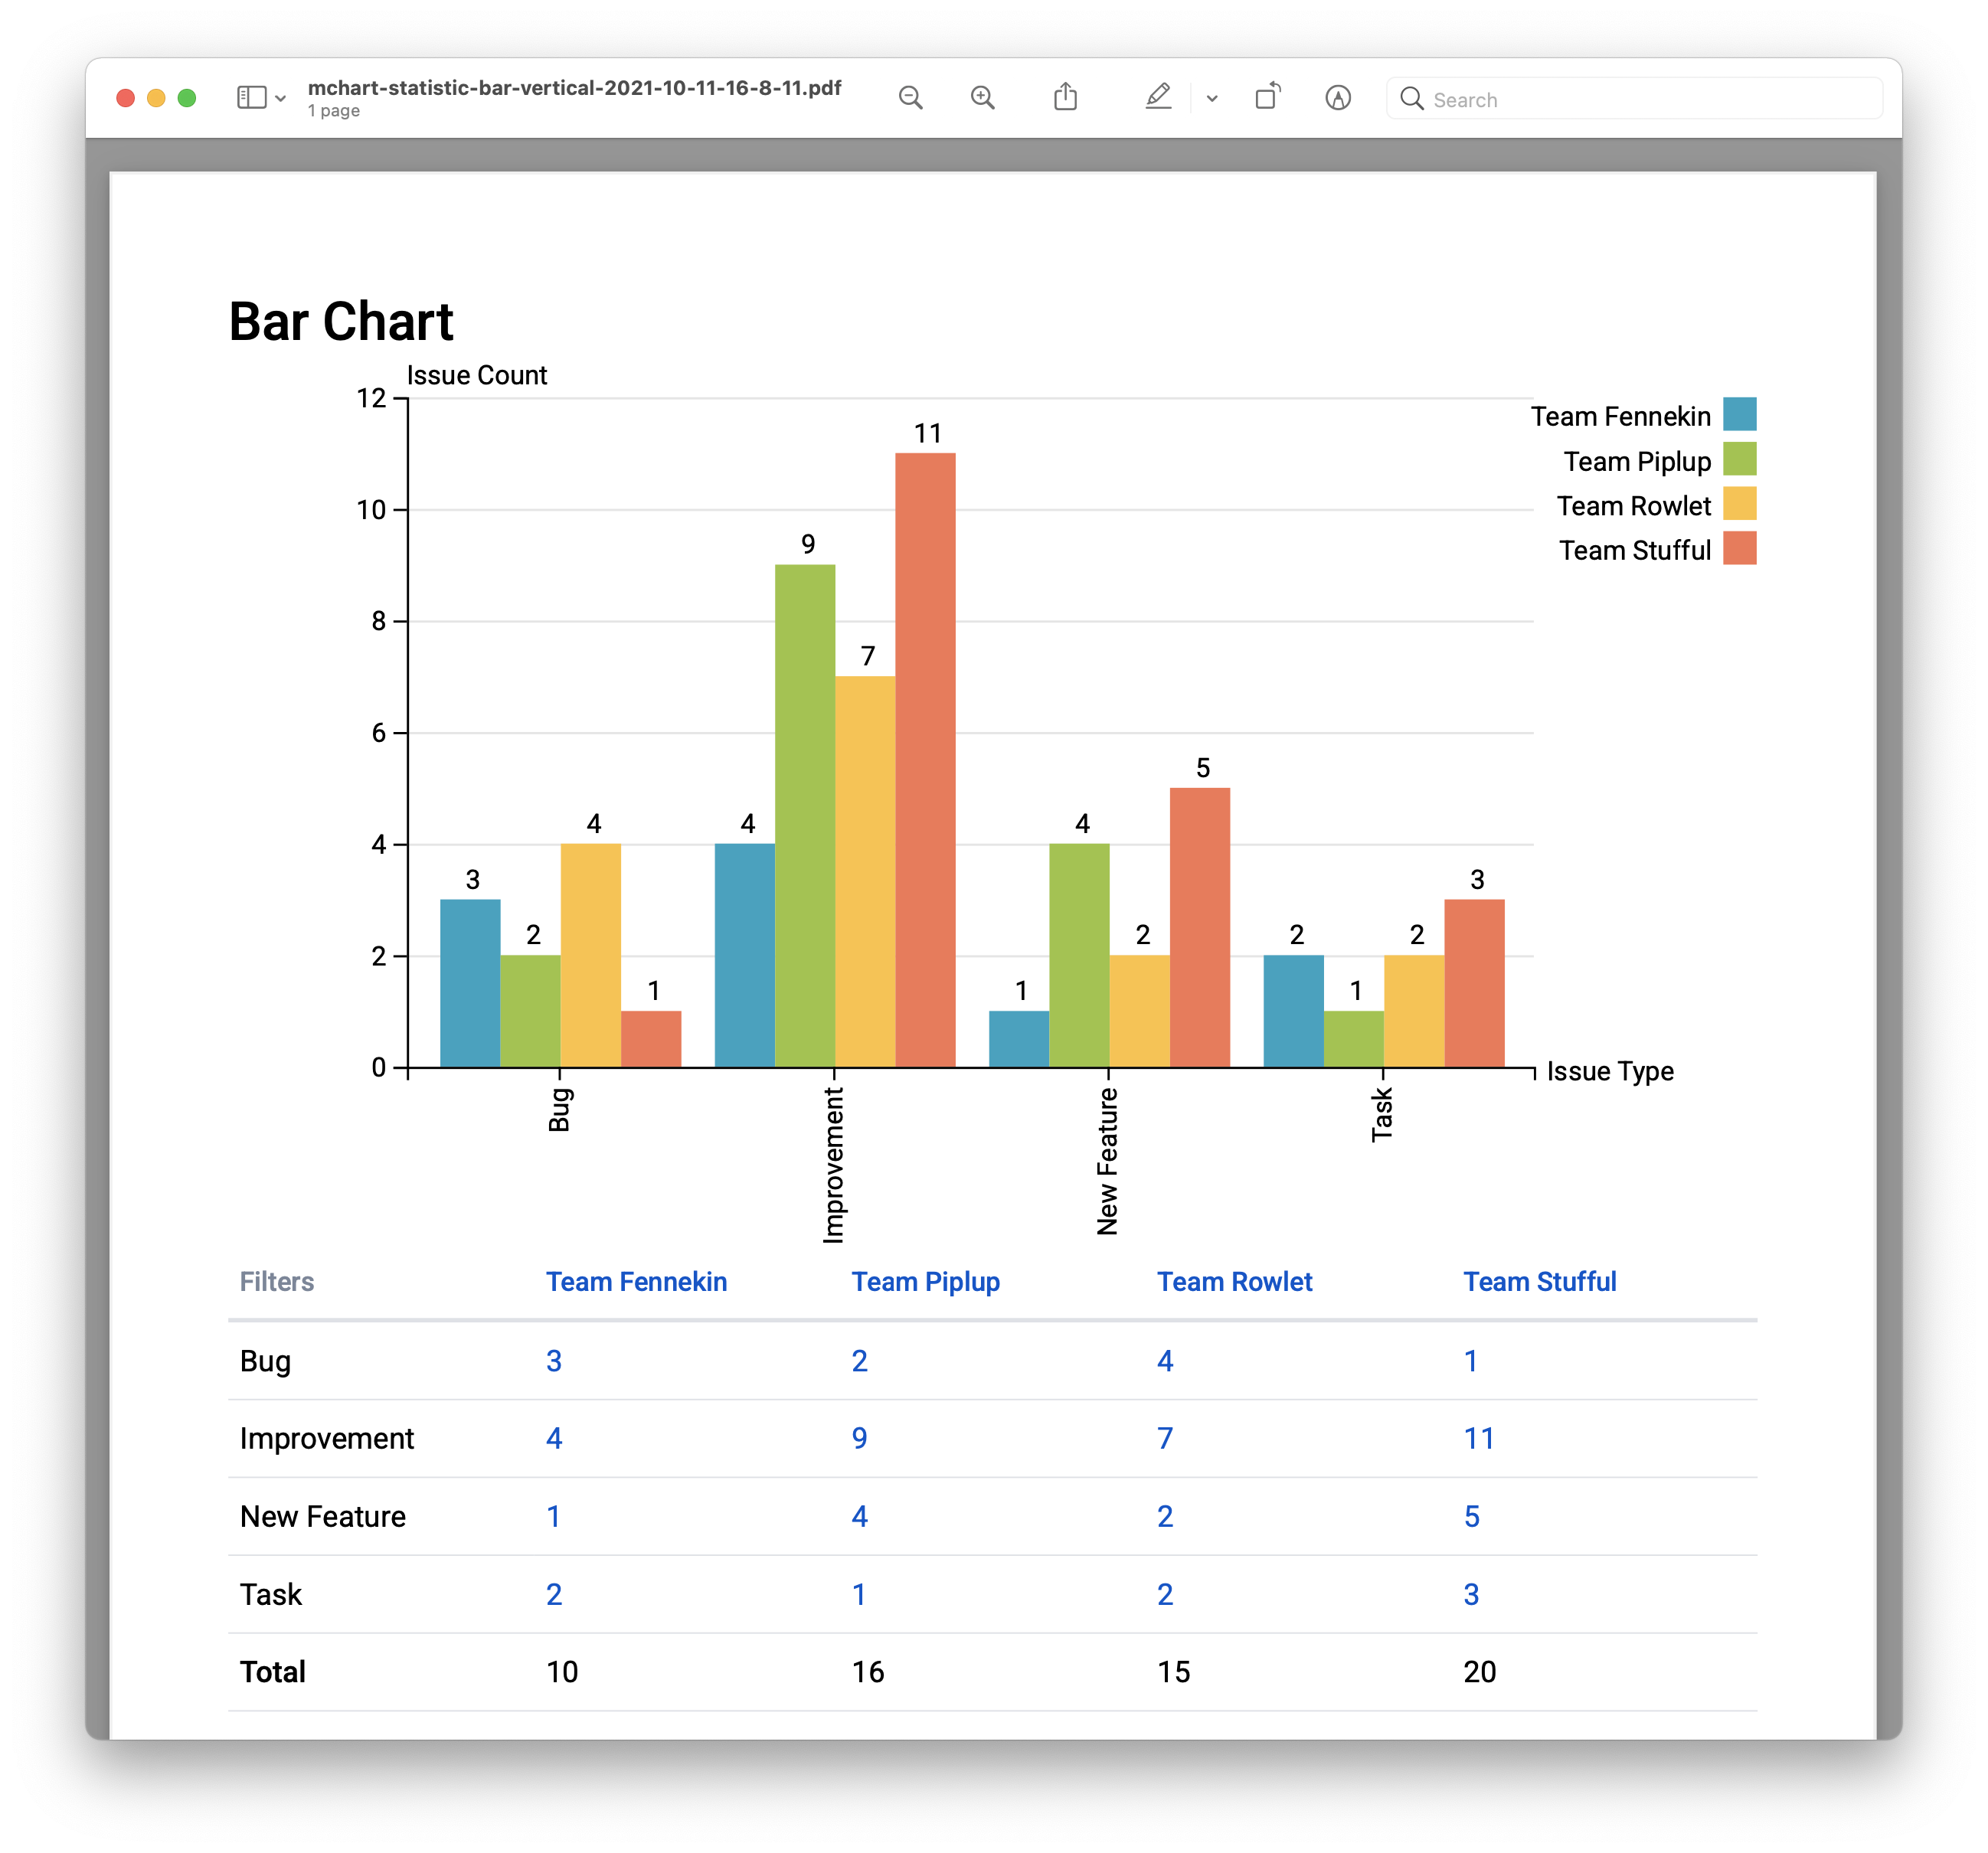
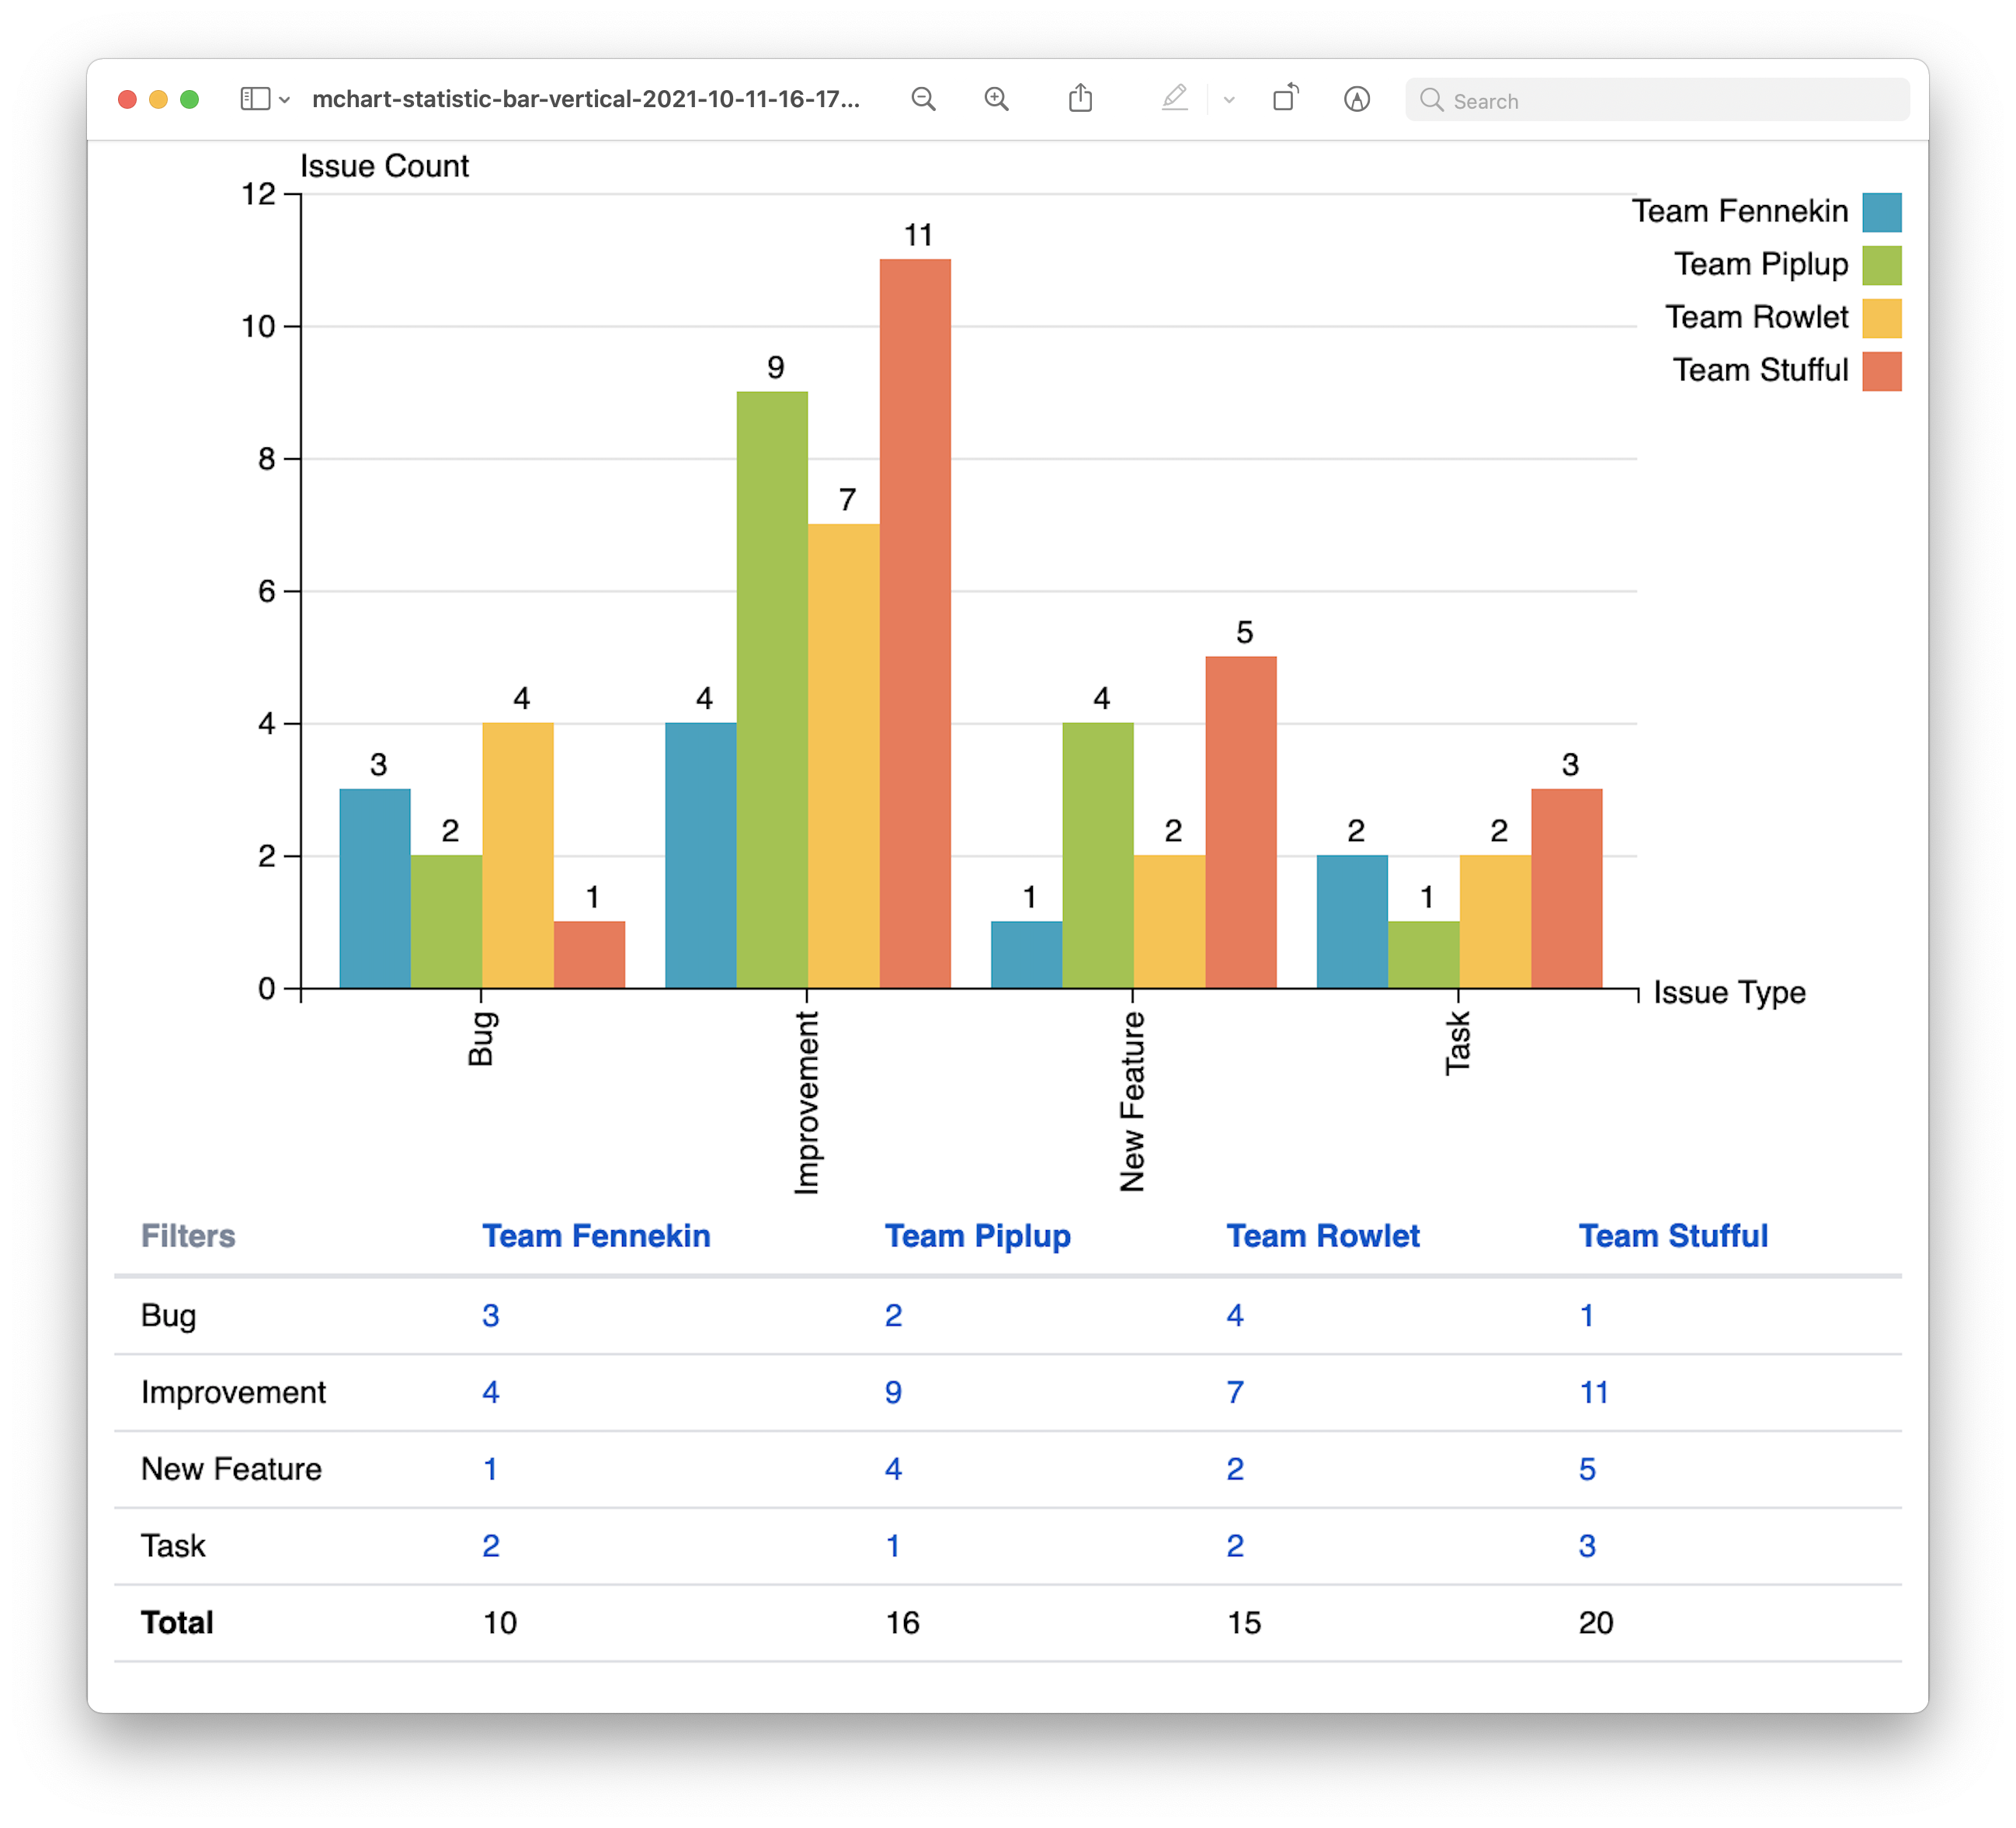
Export as PDF or PNG
You can now export the chart and/or data table as PDF or PNG.
Refer to the supported browsers for exporting as PDF.
|
Options |
Sample PDF |
Sample PNG |
|---|---|---|
|
|
|
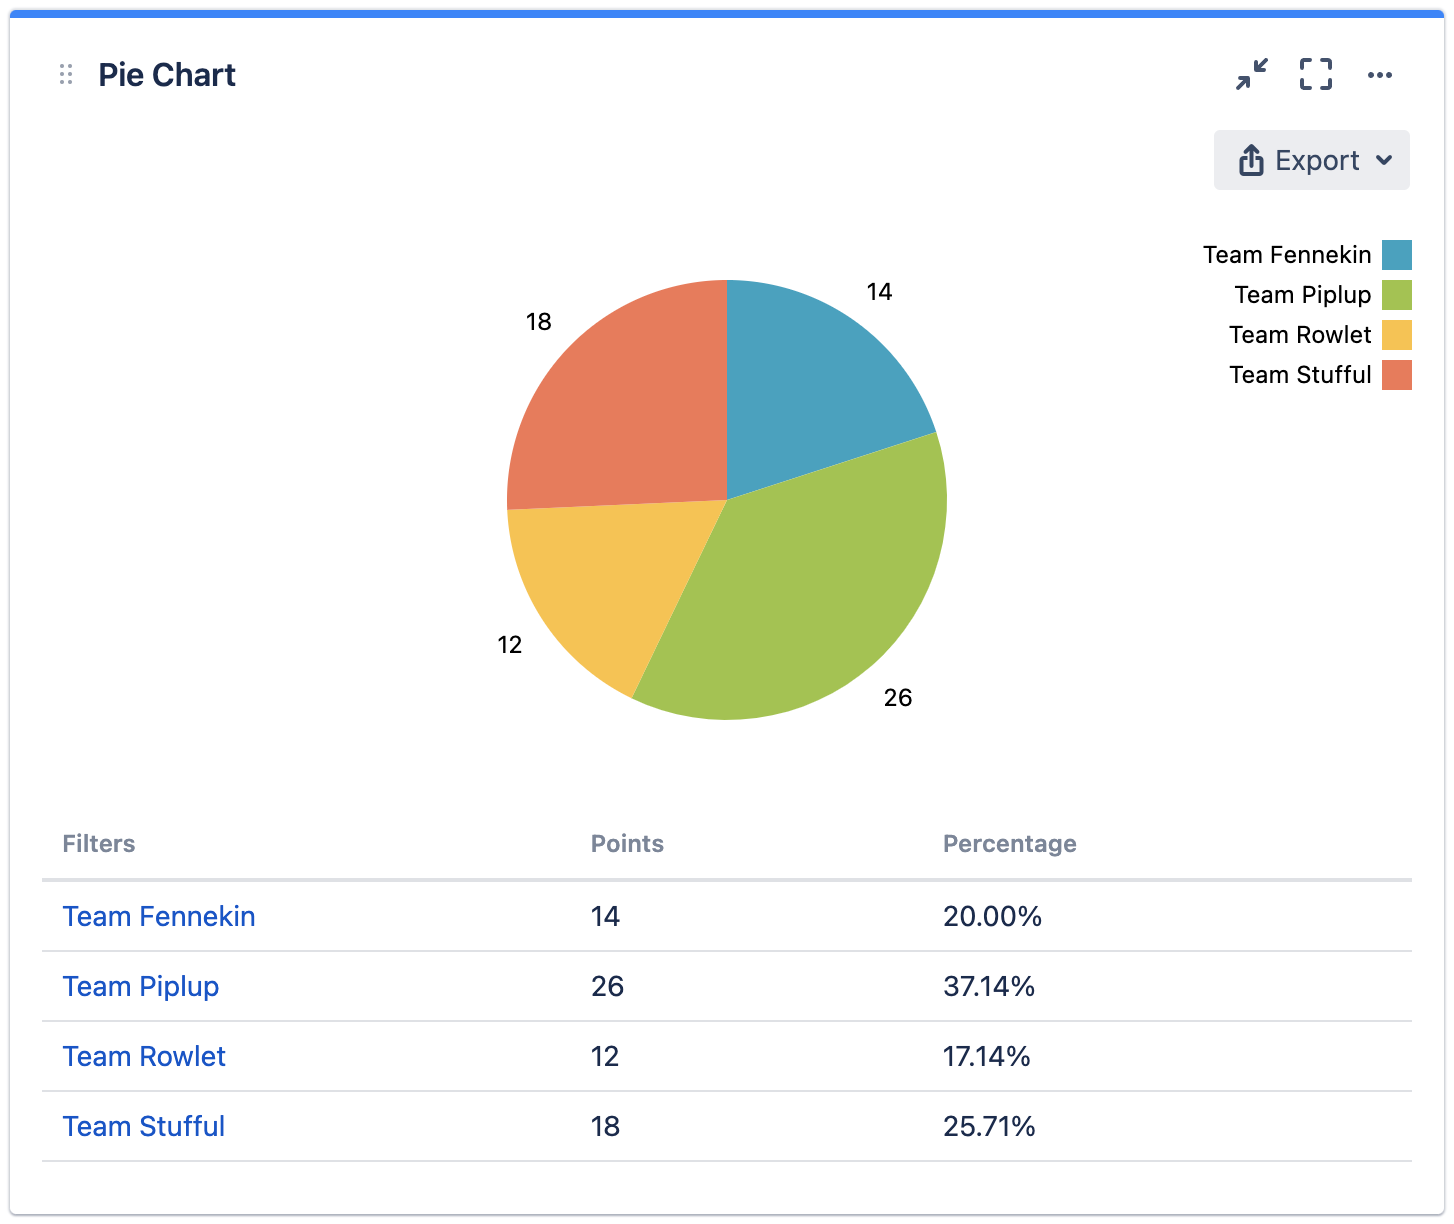
Support sum of number/time fields in pie chart
Updated the options for Value Type and added Calculation Mode.
|
Before |
After |
|---|---|
|
Value Type
|
Value Type
Calculation Mode
|
Filter value will not be included in the pie chart if the sum value is negative.
|
All filters with positive values |
One or more filters with negative values |
|---|---|
|
.png?cb=3557c0121f48aaf5545063002b5ddf45)
|
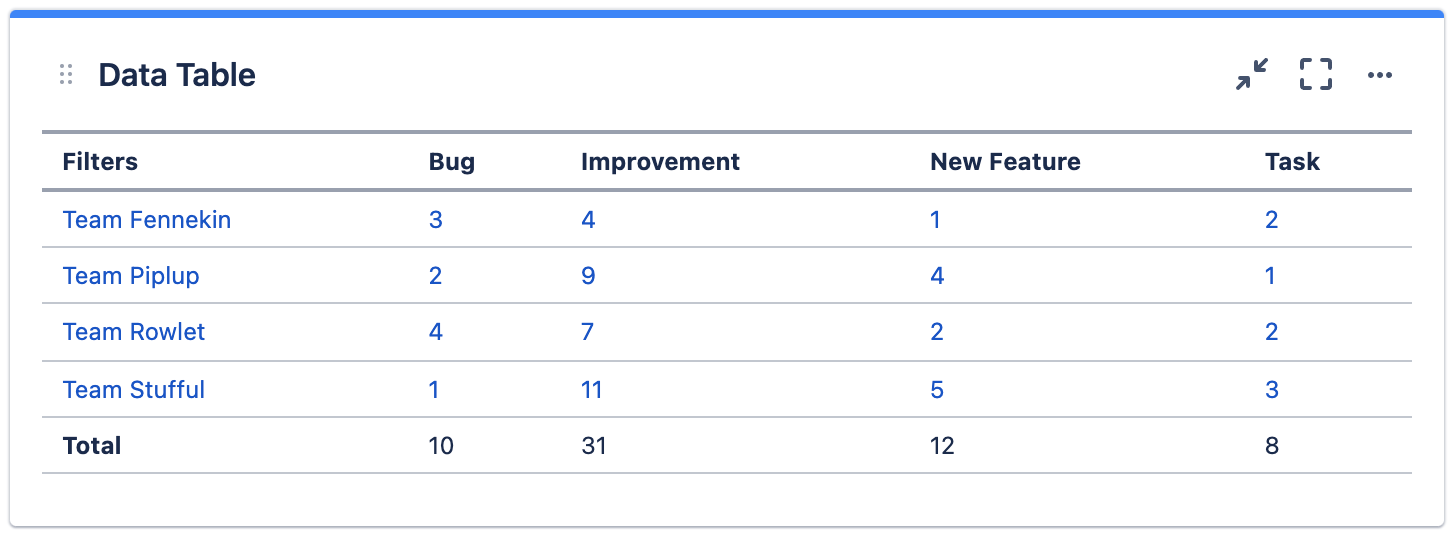
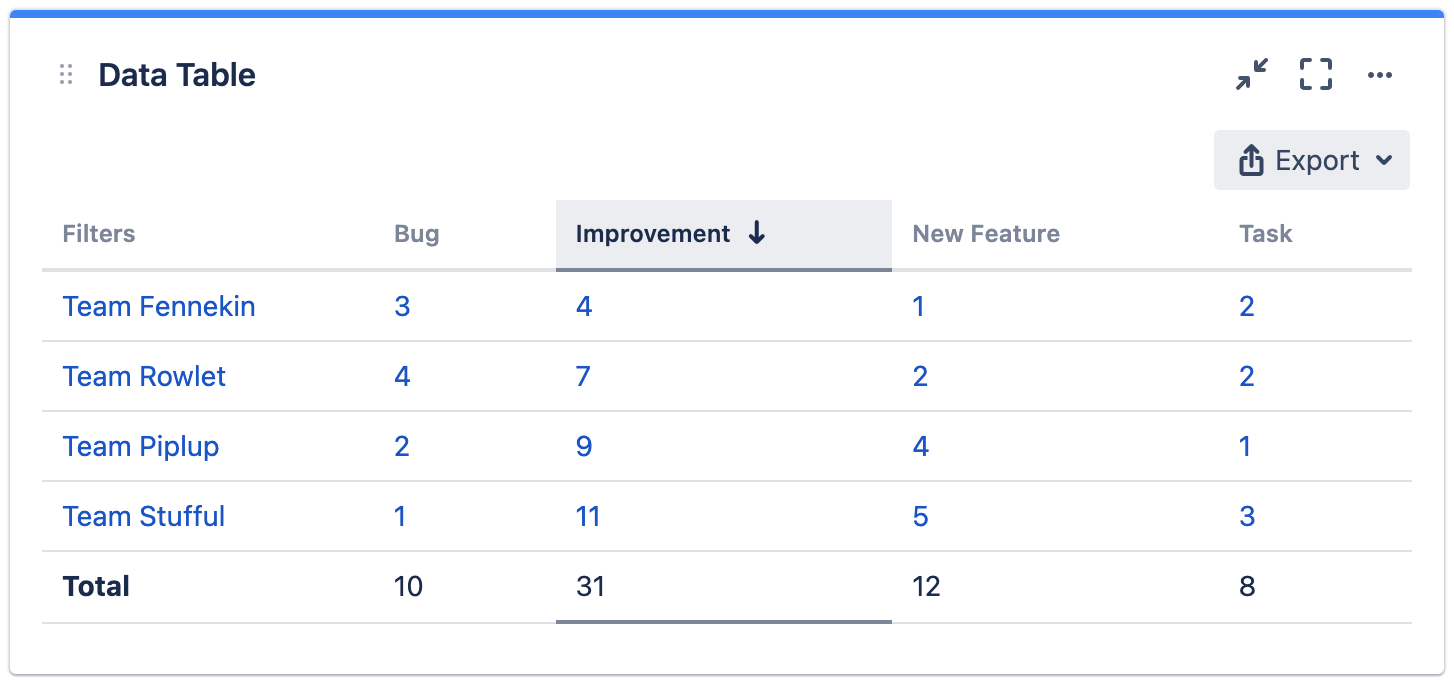
Sortable data table
Data table can now be sorted by clicking on the headers.
|
Before |
After |
|---|---|
|
|
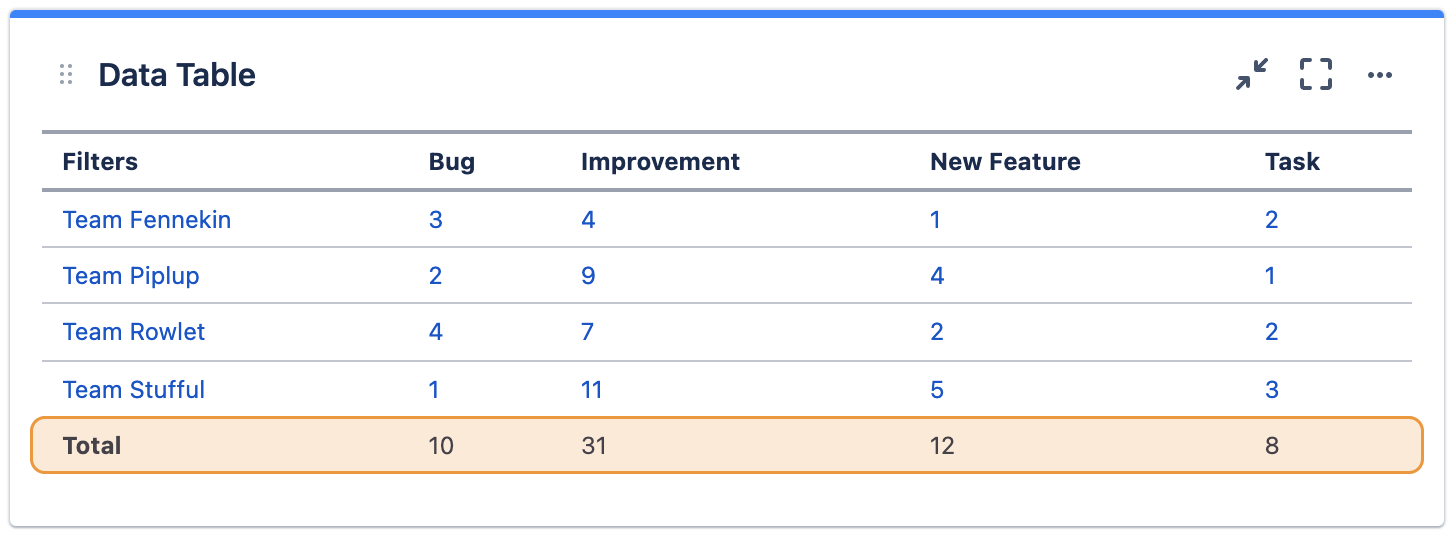
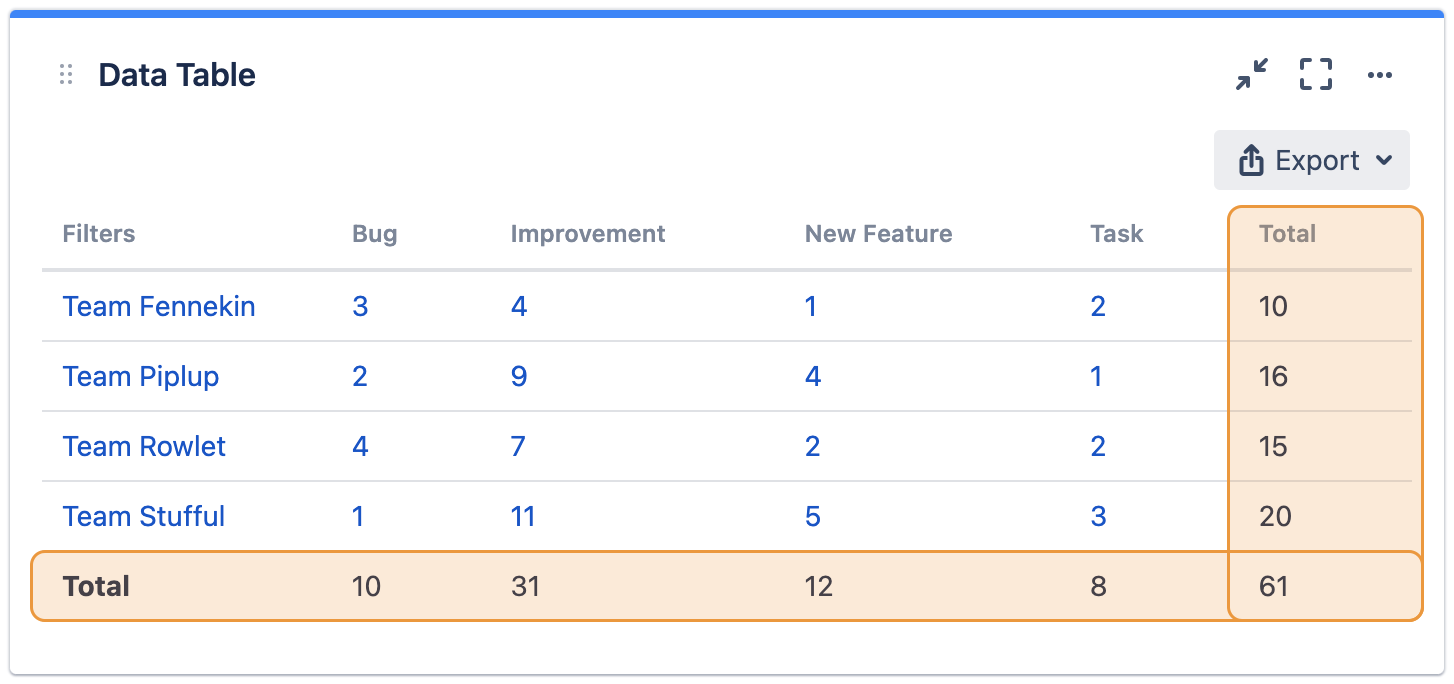
Show Totals
You can now choose to show totals for rows, columns or both in the data table.
|
Before |
After |
|---|---|
|
Sum Up Rows
|
Show Totals
|
|
|
UI Improvements
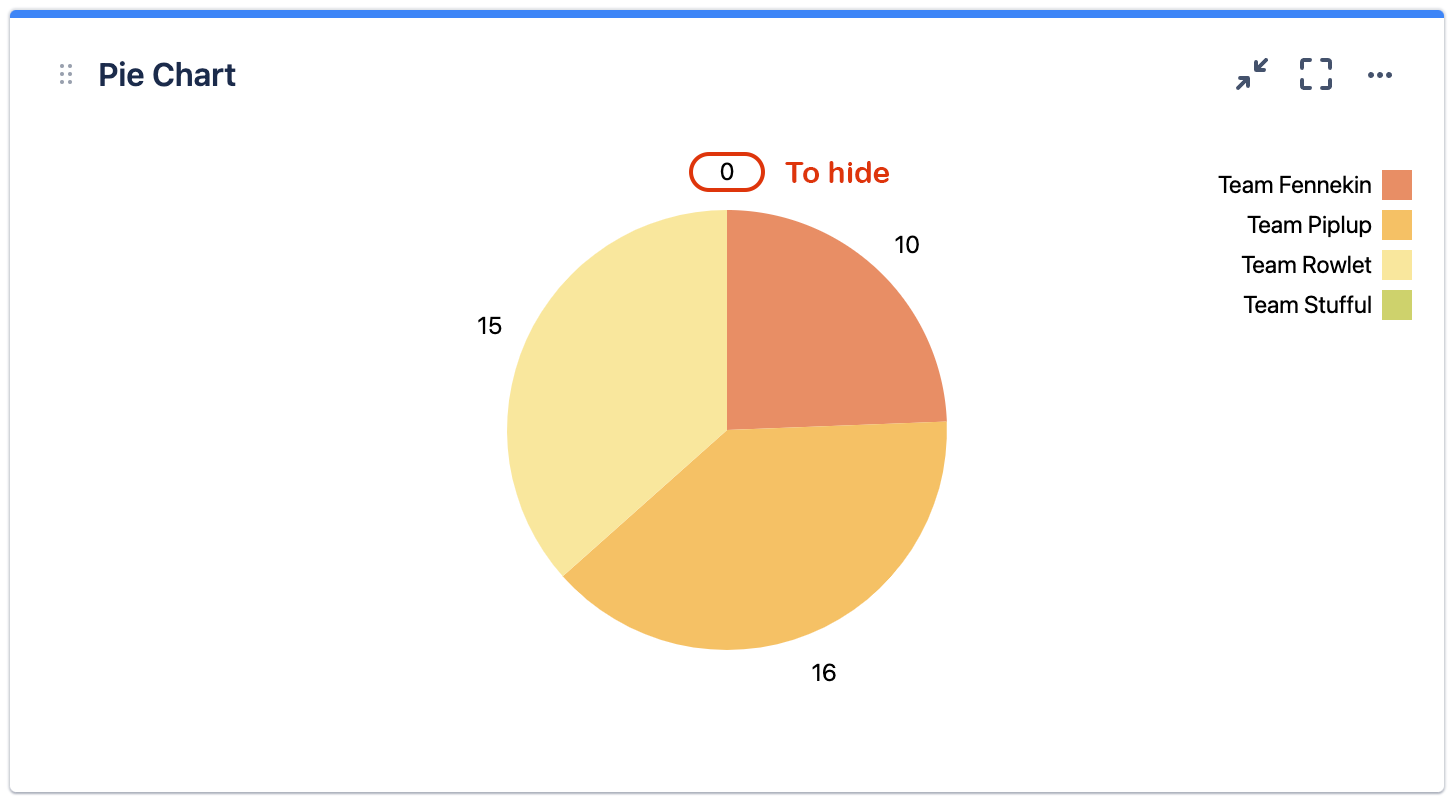
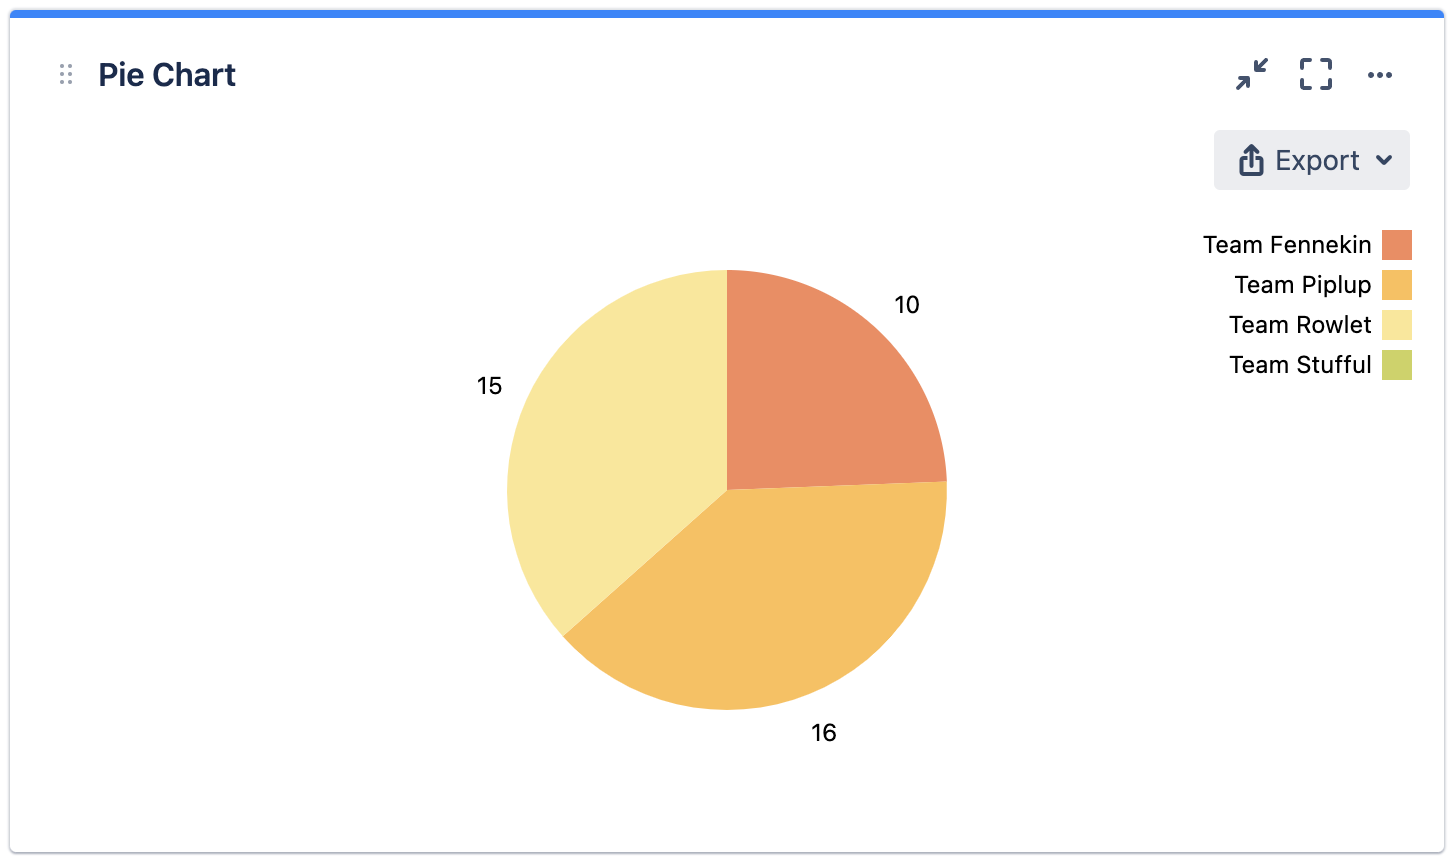
Hide 0 or 0.00% labels in pie chart
The 0 or 0.00% labels in pie chart are now hidden.
|
Before |
After |
|---|---|
|
|
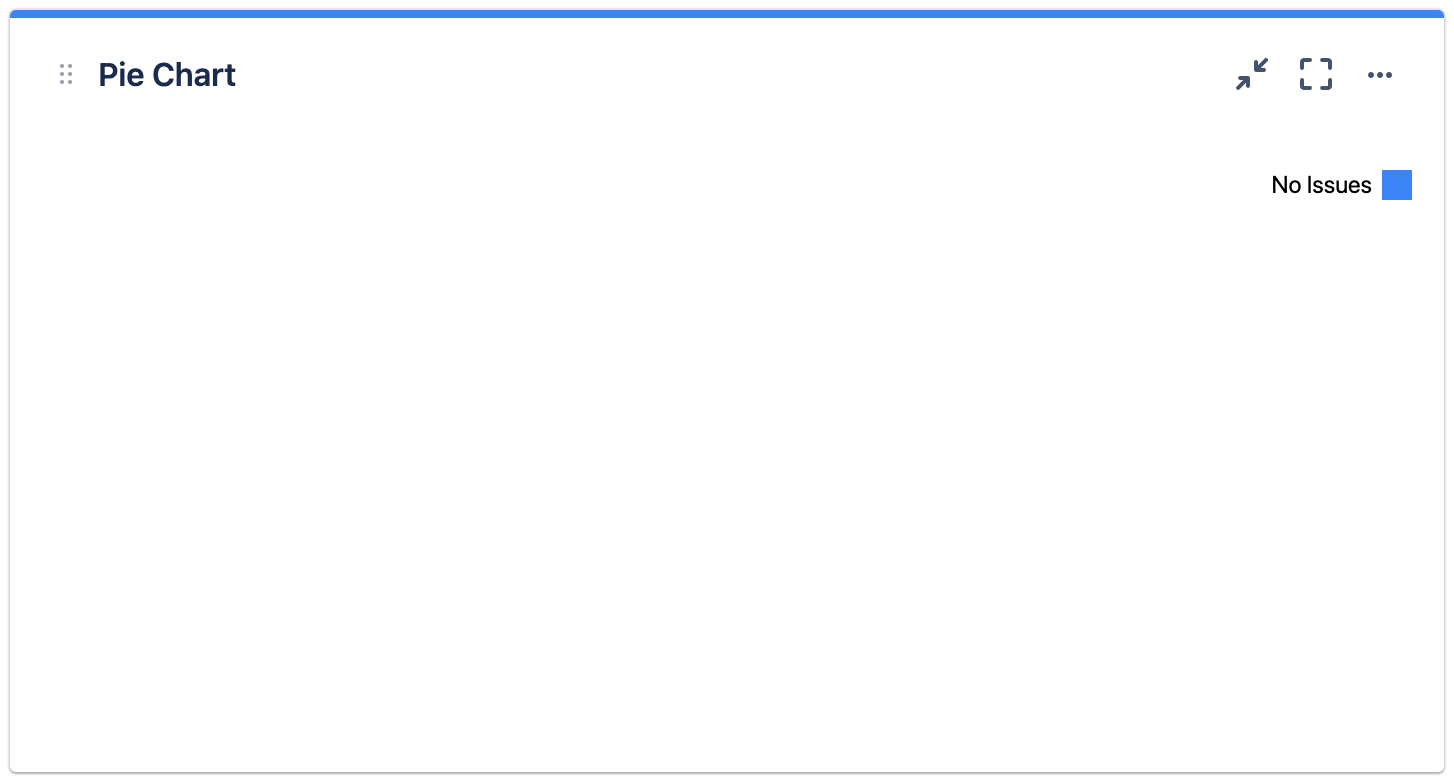
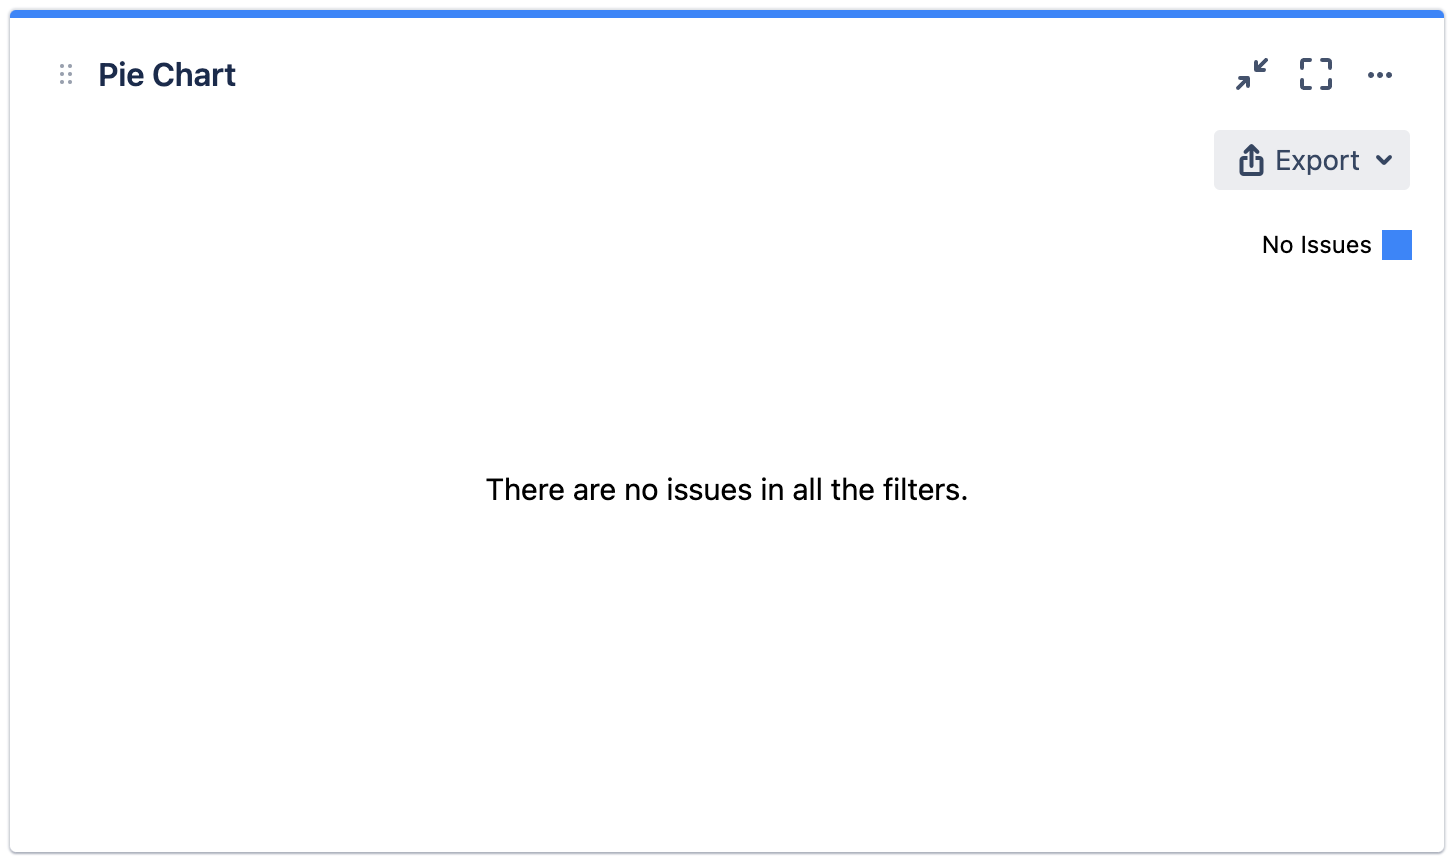
Display message if no issues/value for pie chart
Message is displayed to notify users if there are no issues/value to plot the pie chart.
|
Before |
After |
|---|---|
|
|
Bug Fixes
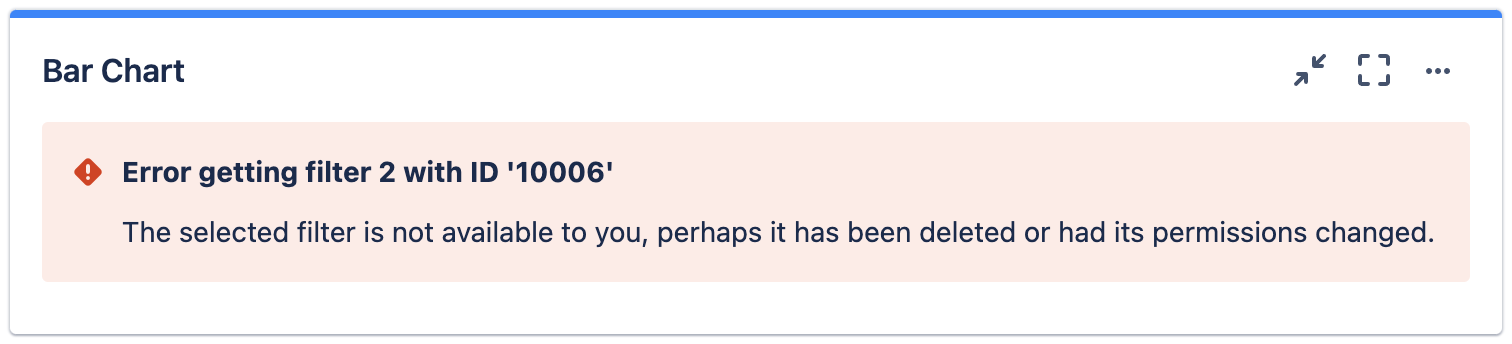
Gadget loads endlessly if no filter permission
This affects all the gadgets.
|
Before |
After |
|---|---|
|
|
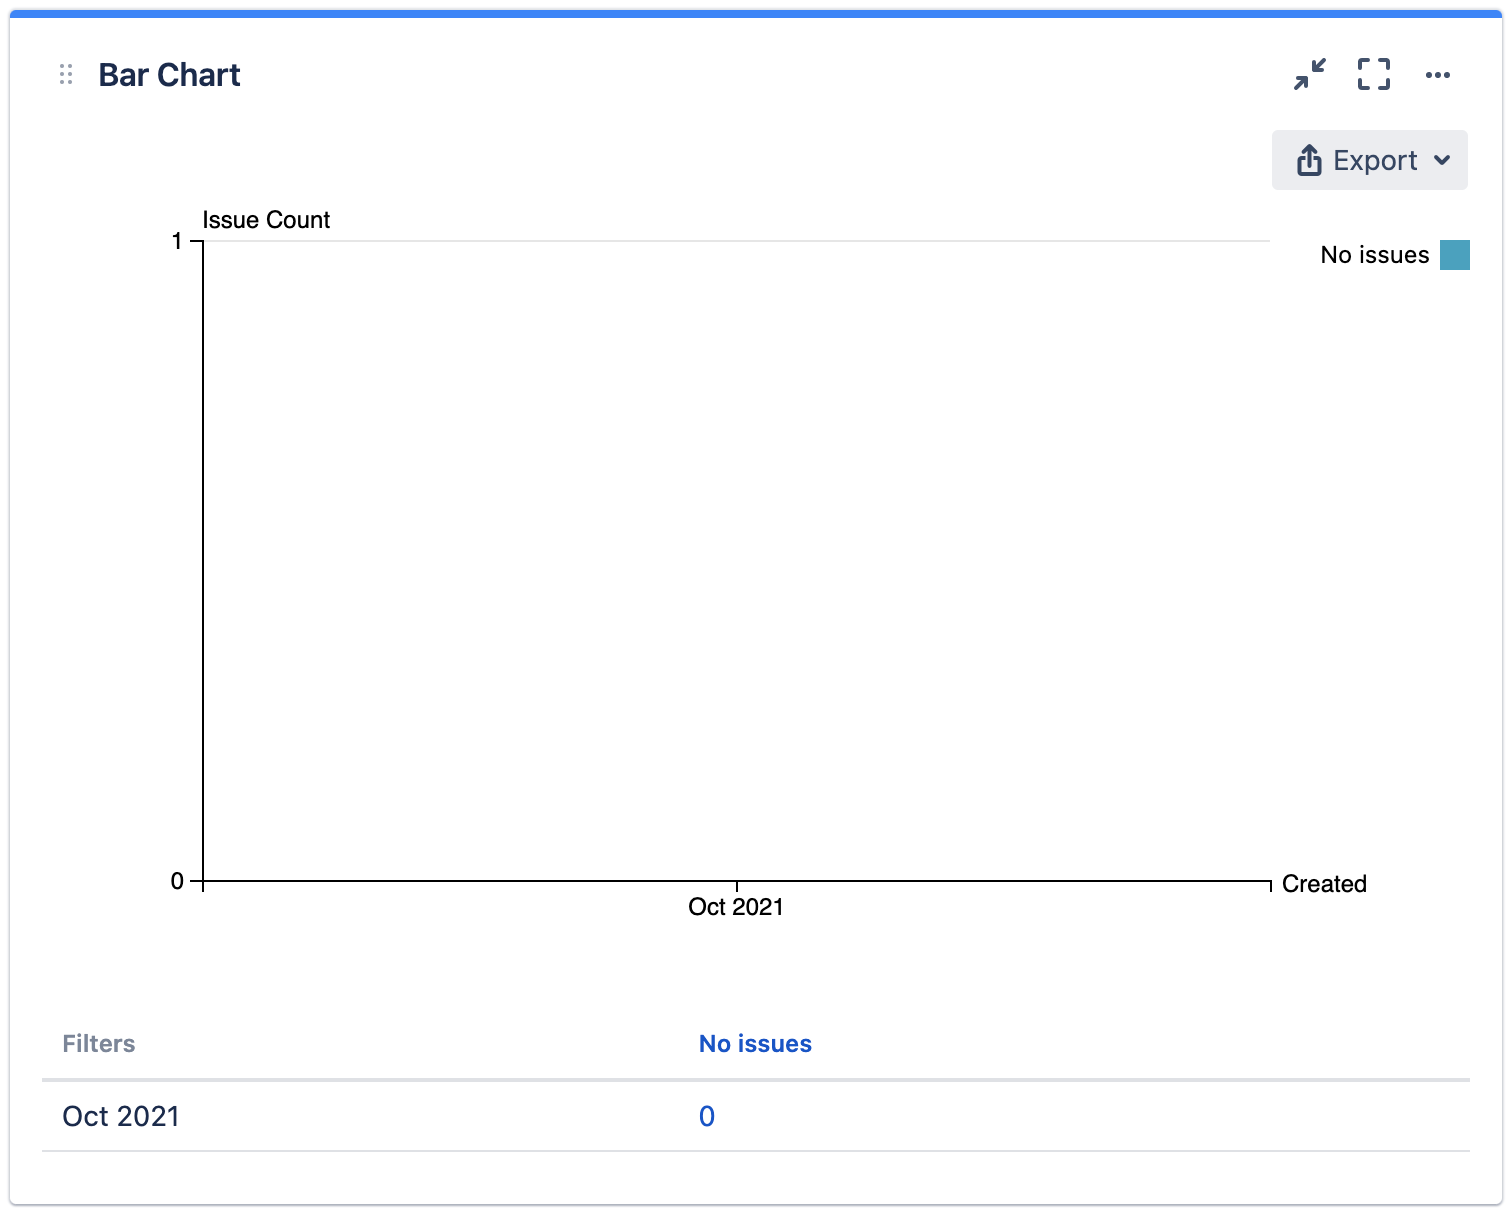
Gadget loads endlessly if no issues in all filters
This affects the following 2 gadgets:
-
Multiple Filters Bar Chart Gadget
-
Multiple Filters Line Chart Gadget
|
Before |
After |
|---|---|
|
|
|