This documentation is for Cloud only. Click here for the Data Center documentation.
Multiple Filters Chart Gadget for Jira Cloud allows combining of multiple filters/JQL into a single chart for easy comparison.
10 gadgets available
📊 Bar Chart
🟡 Pie Chart
🔢 Counter
Key Features
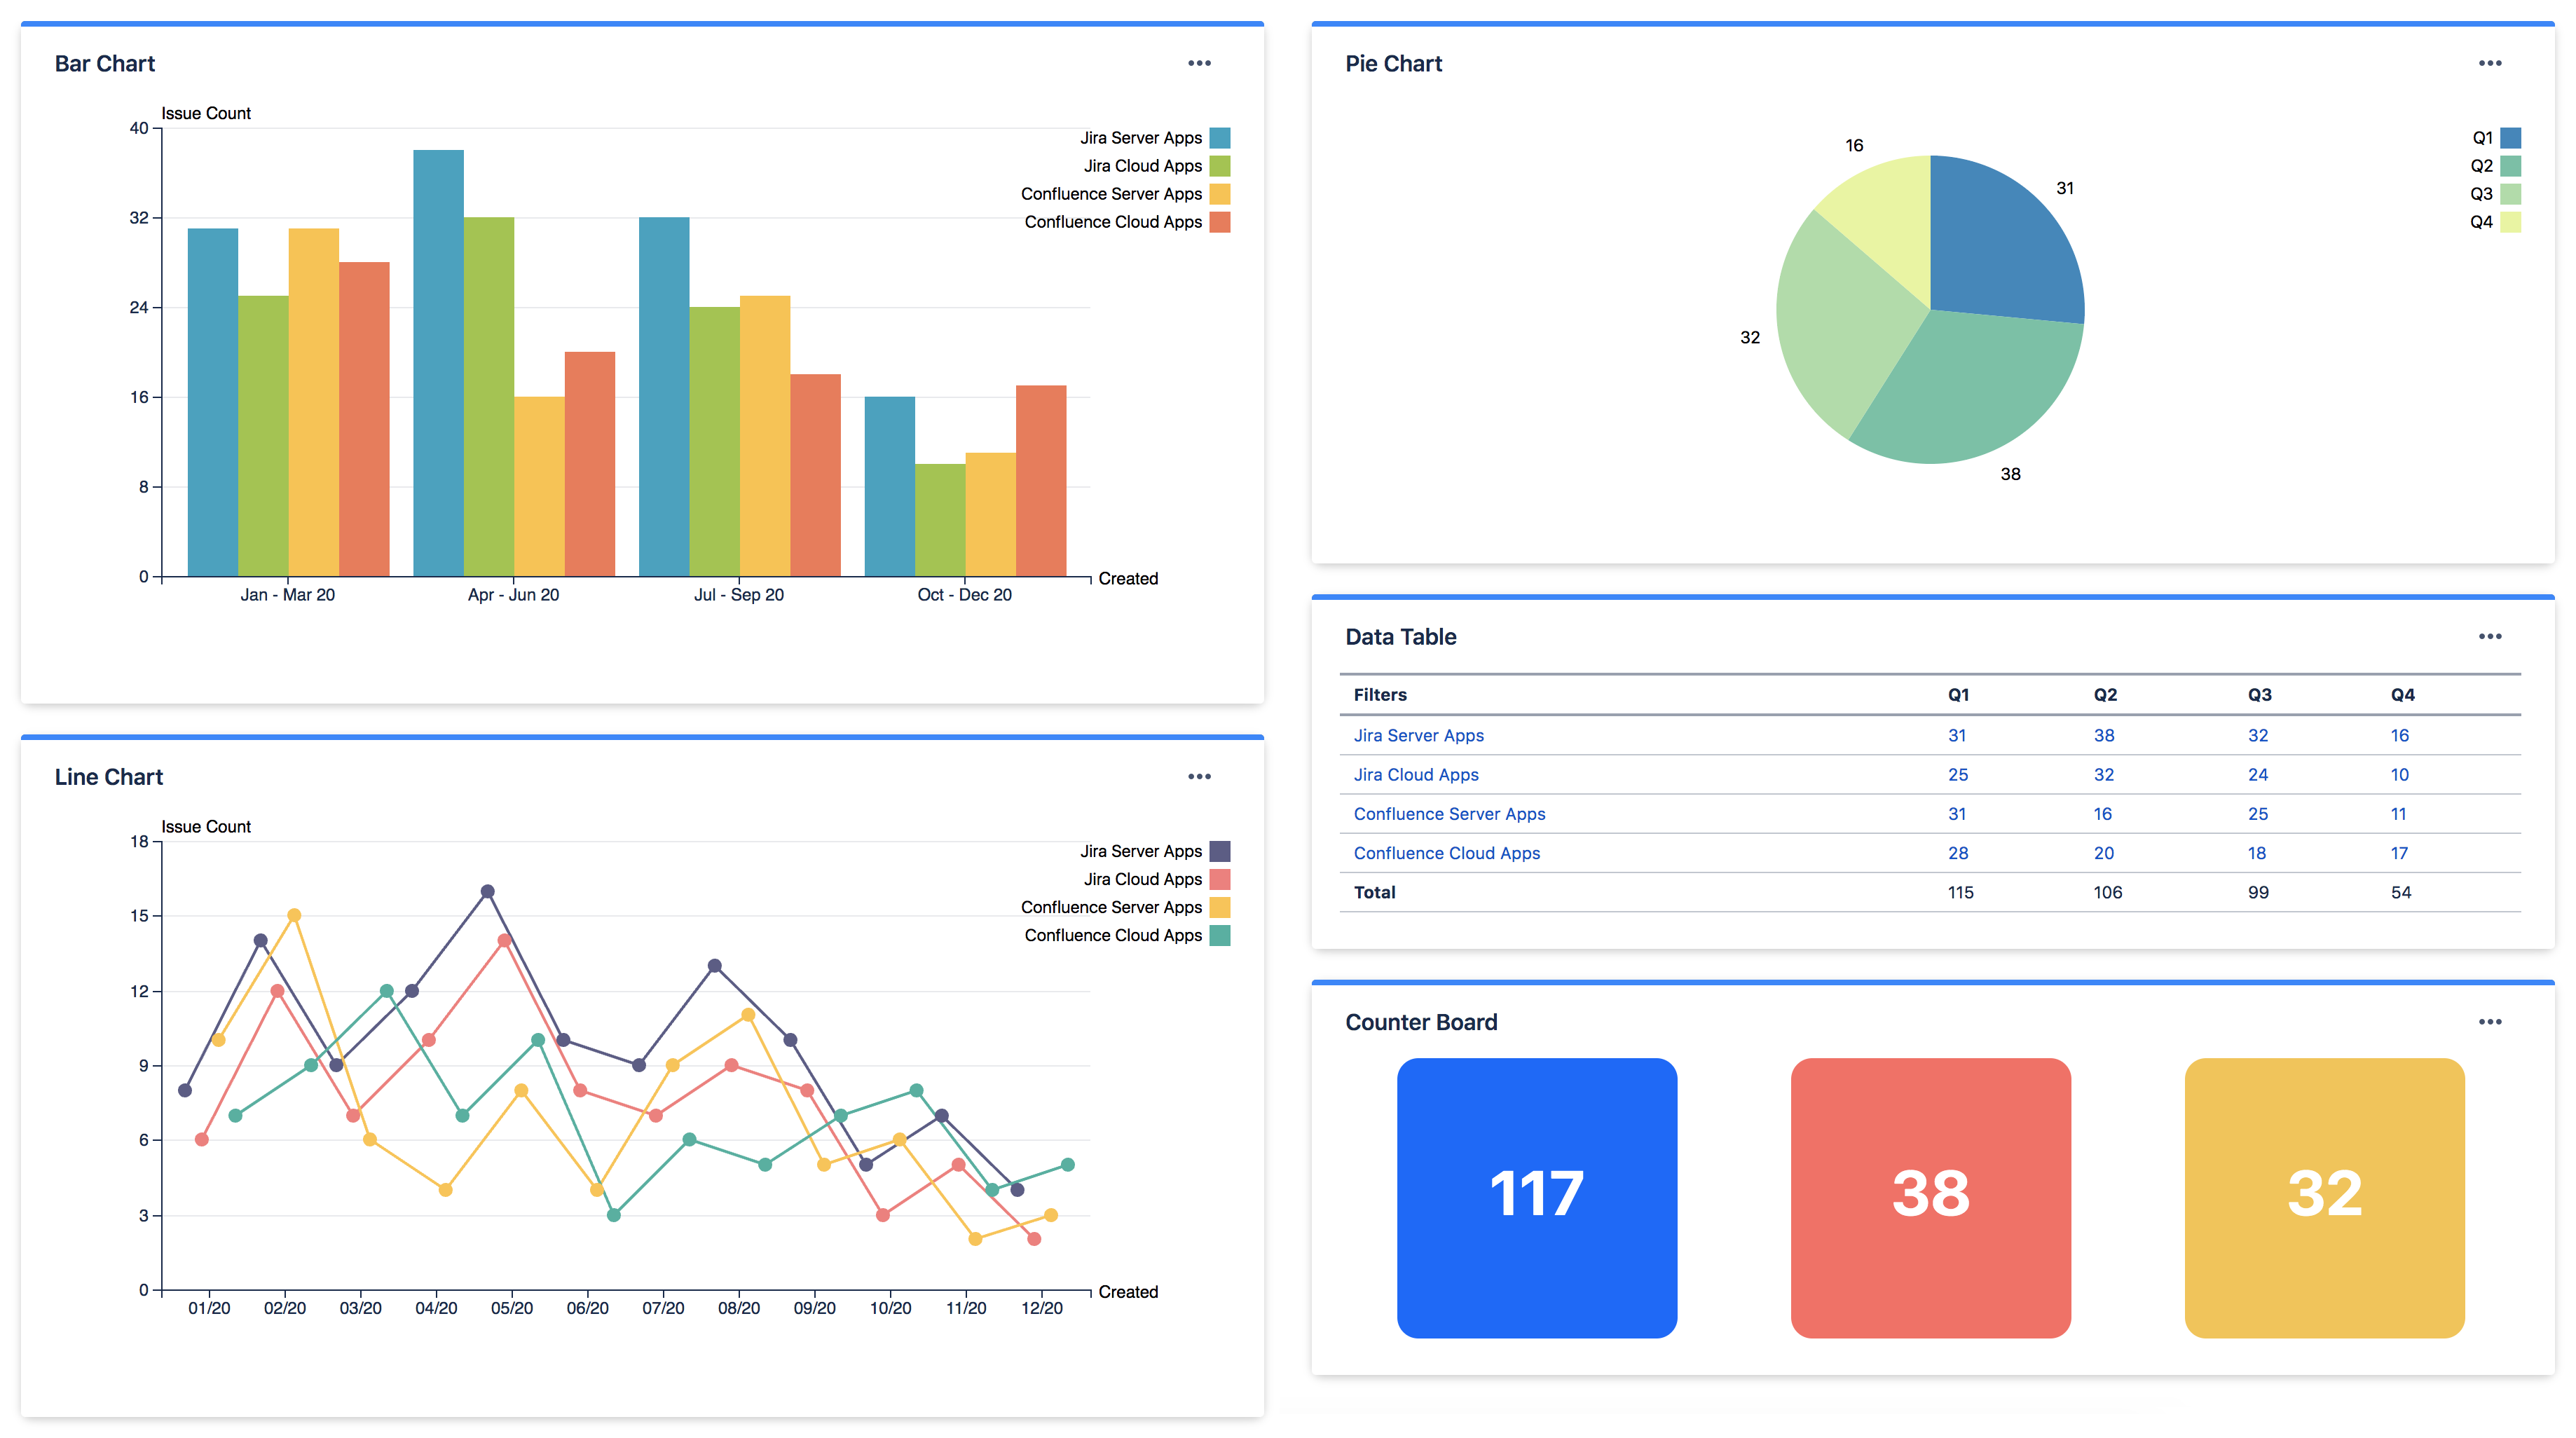
5 types of data visualisation
Visualise data with bar chart, line chart, pie chart, data table or counter board.
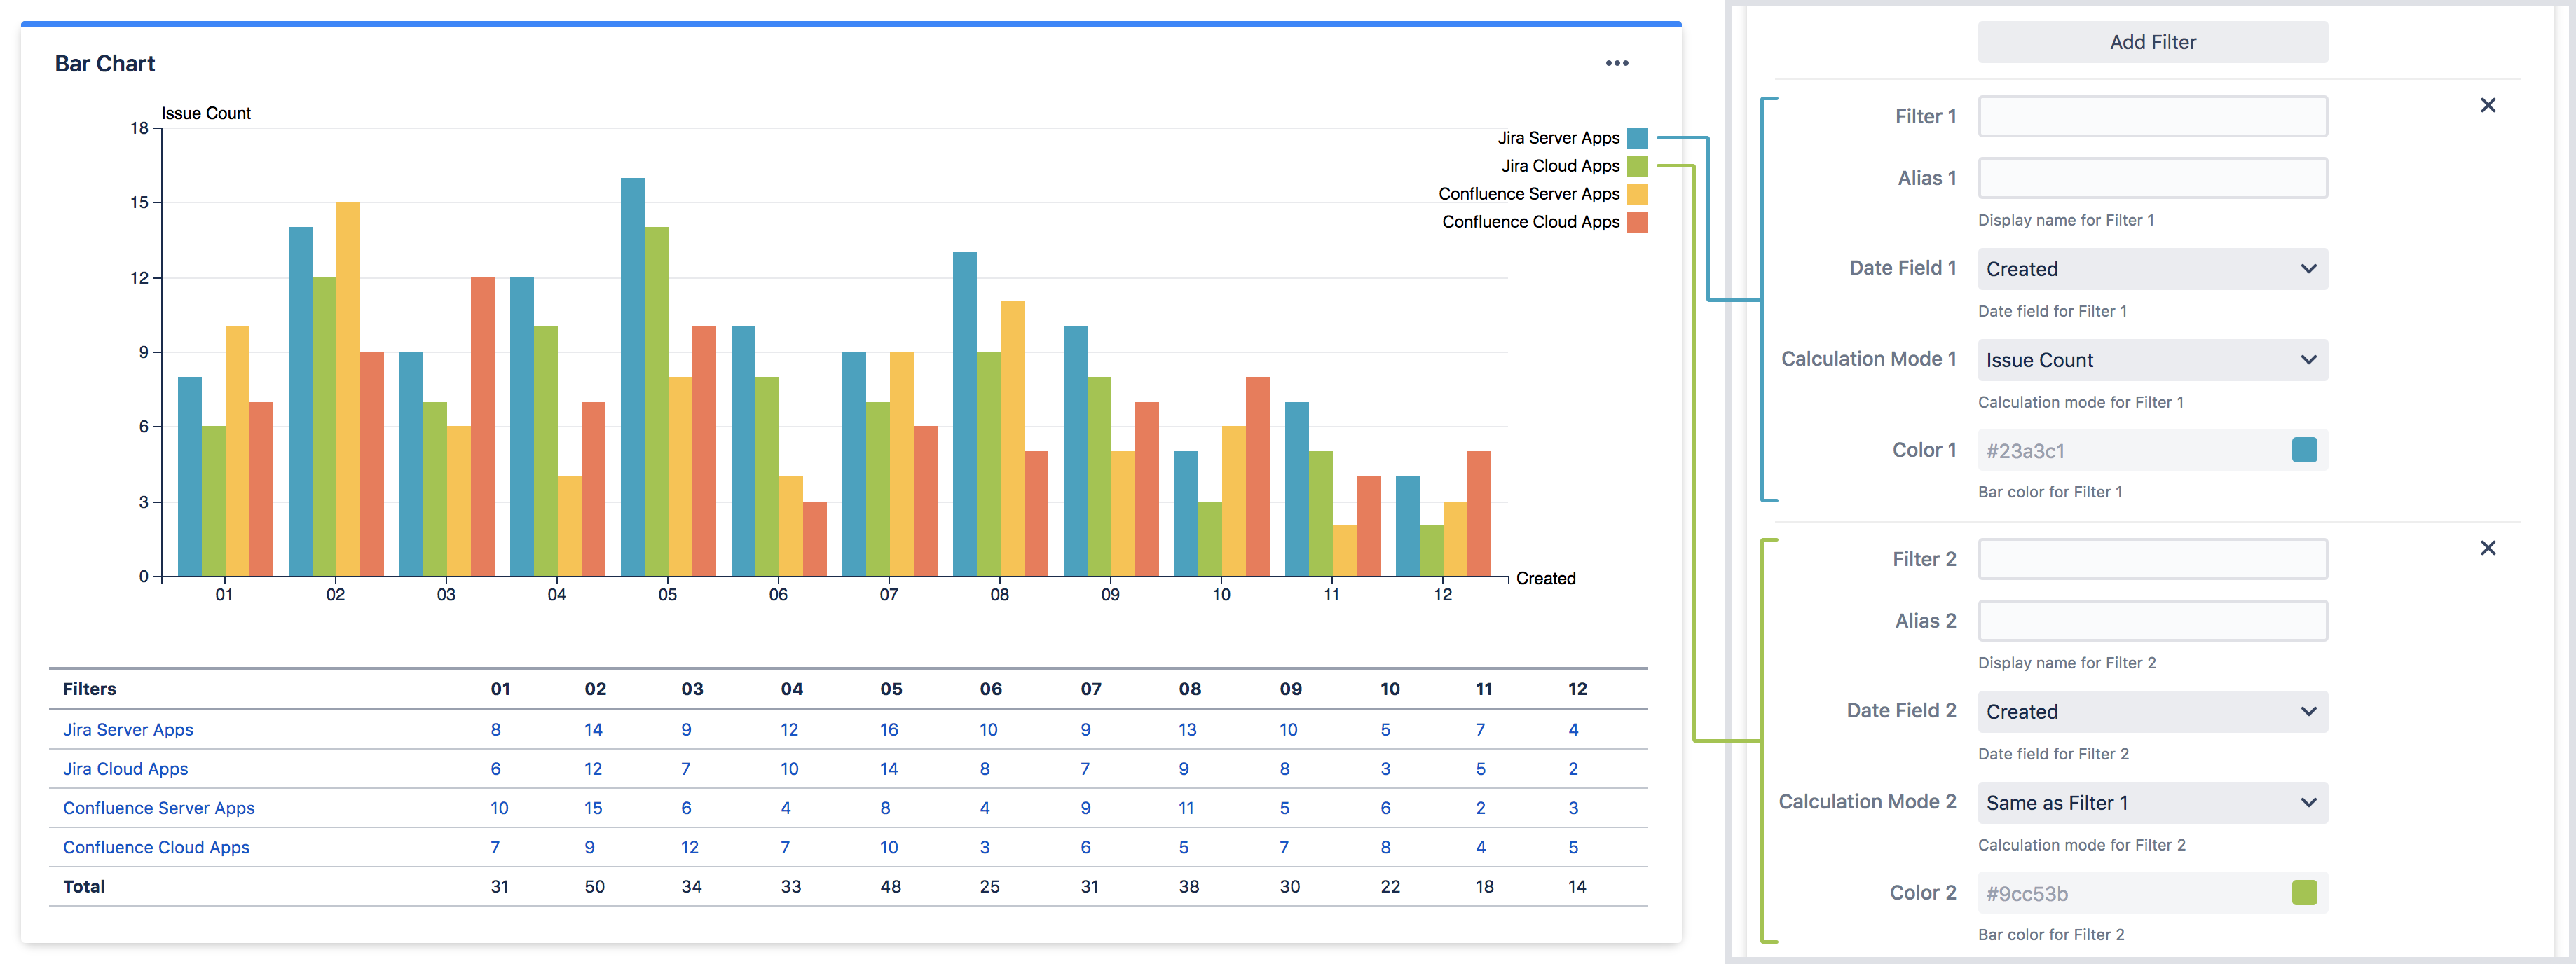
Combine multiple filters into one
Add up to 12 filters in a gadget. Choose to display chart only, data table only or both.
Various customisation options
Various options are available in each gadget for customisation.
For example:
-
Display chart in normal or cumulative mode
-
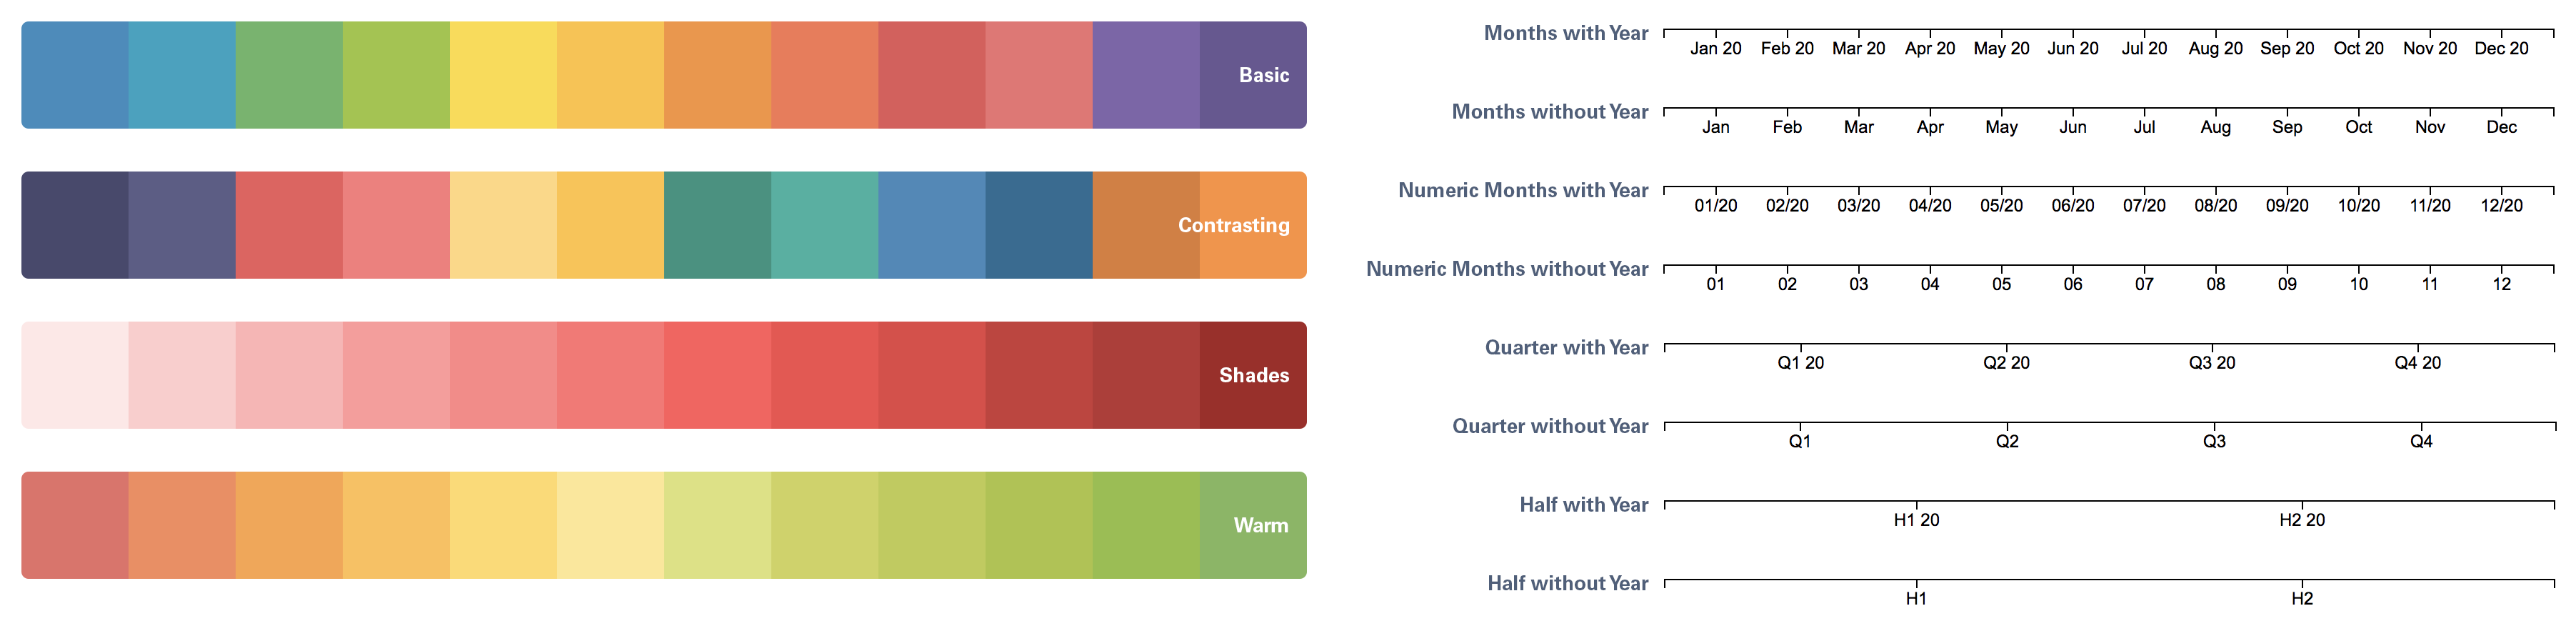
Choose from the 4 predefined color schemes or customise your own
-
Select your preferred period format