How to Configure Multiple Filters Pie Chart Gadget
Settings | Default Value | Explanation |
|---|---|---|
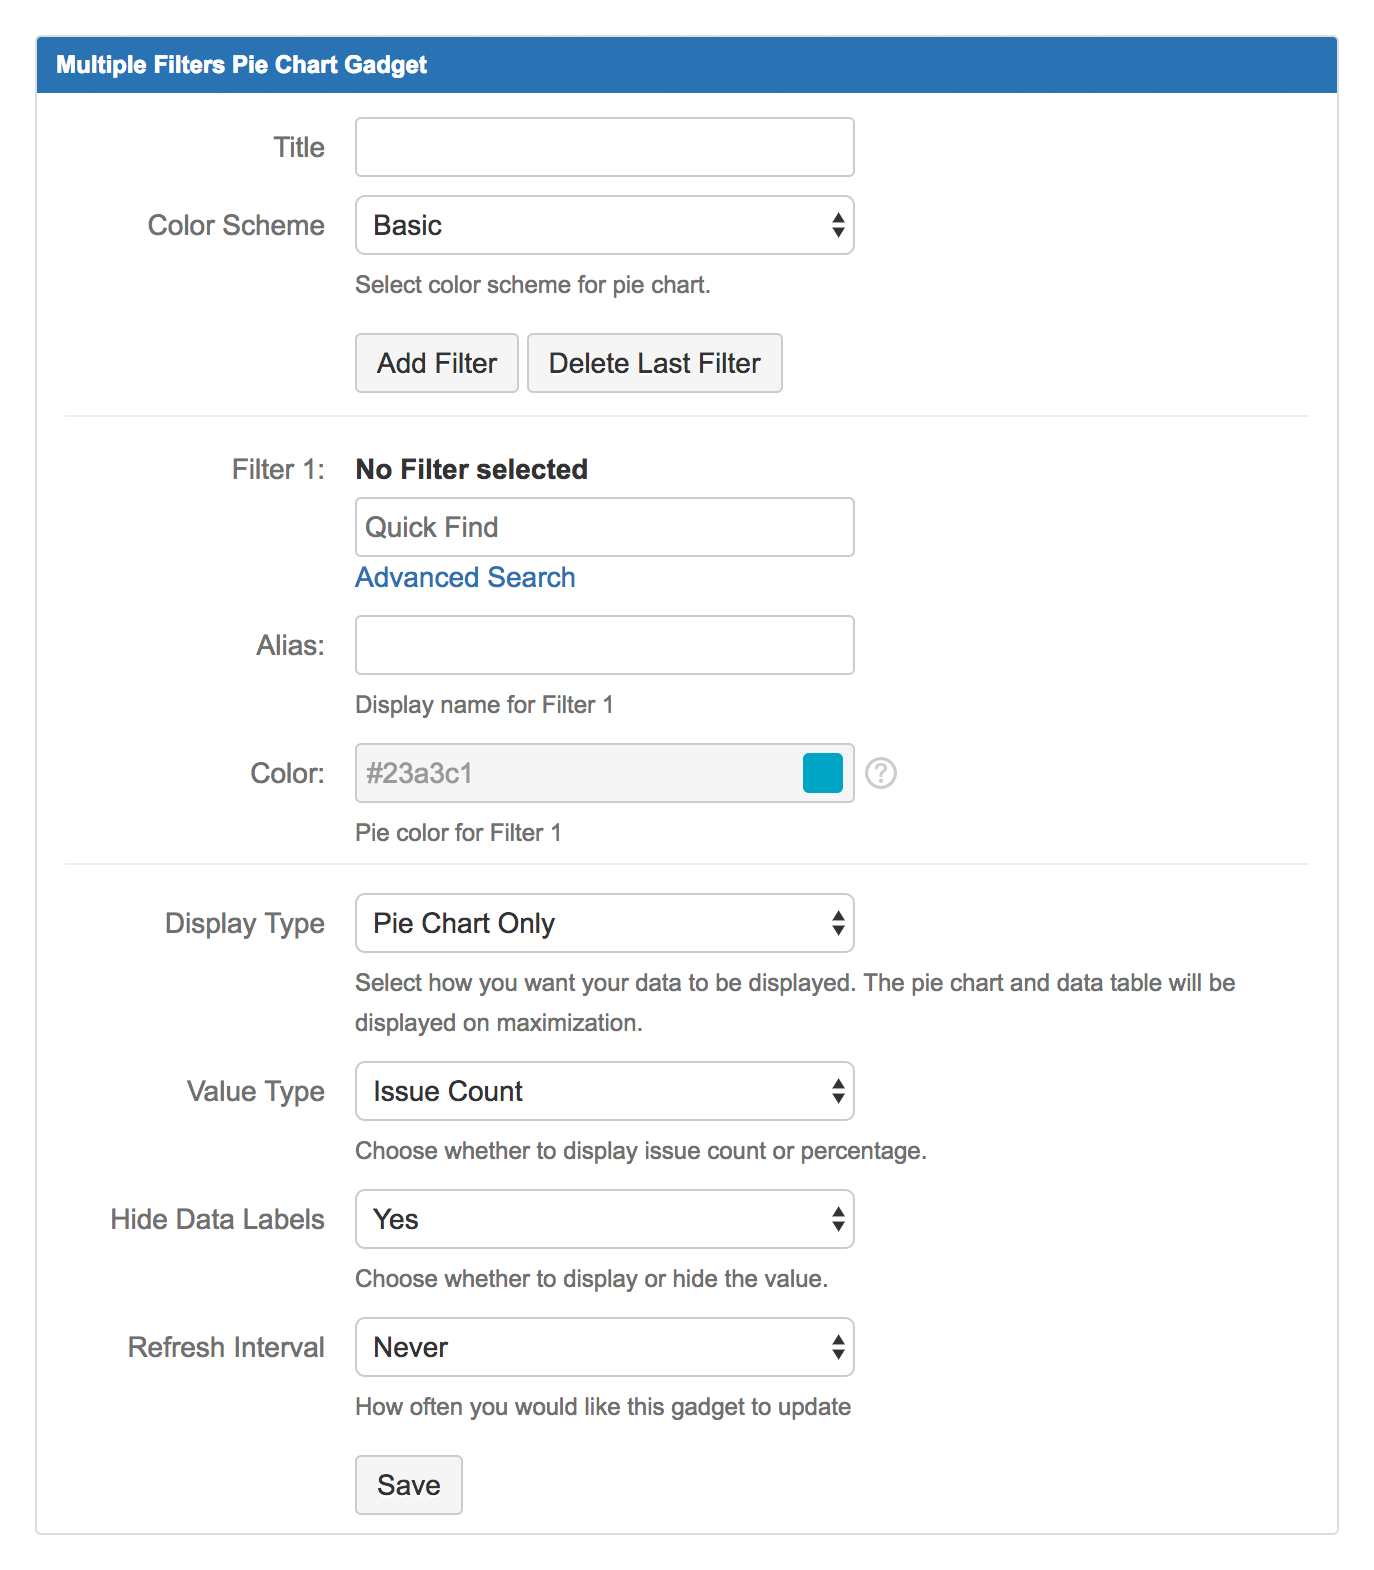
| Title | Enter title for the pie chart window. | |
| Color Scheme | Basic | Select a color scheme:
|
Add Filter | Click to add another filter. | |
Delete Last Filter | Click to delete the last filter. | |
| Filter n (max. 12) | Choose the filter(s) that you want to display in the pie chart. | |
| Alias for Filter n | Define an alias for the filter(s) to be displayed in the legend. If undefined, filter name will be displayed. | |
| Color for Filter n | Pick a color for the pie slice. *Configurable only if Color Scheme is set to Custom. | |
| Display Type | Pie Chart Only | Select the display type of the gadget:
|
| Value Type | Issue Count | Select the value type to be displayed:
|
| Hide Data Labels | Yes | Select whether to display or hide the pie slice value:
|
| Refresh Interval | Never | Select how often (how many minutes interval) the pie chart should be refreshed:
|