Pre-requisites
-
Install Multiple Filters Chart Gadgets version >= 5.20.0 in your Jira
-
Set up Application Link to your Jira
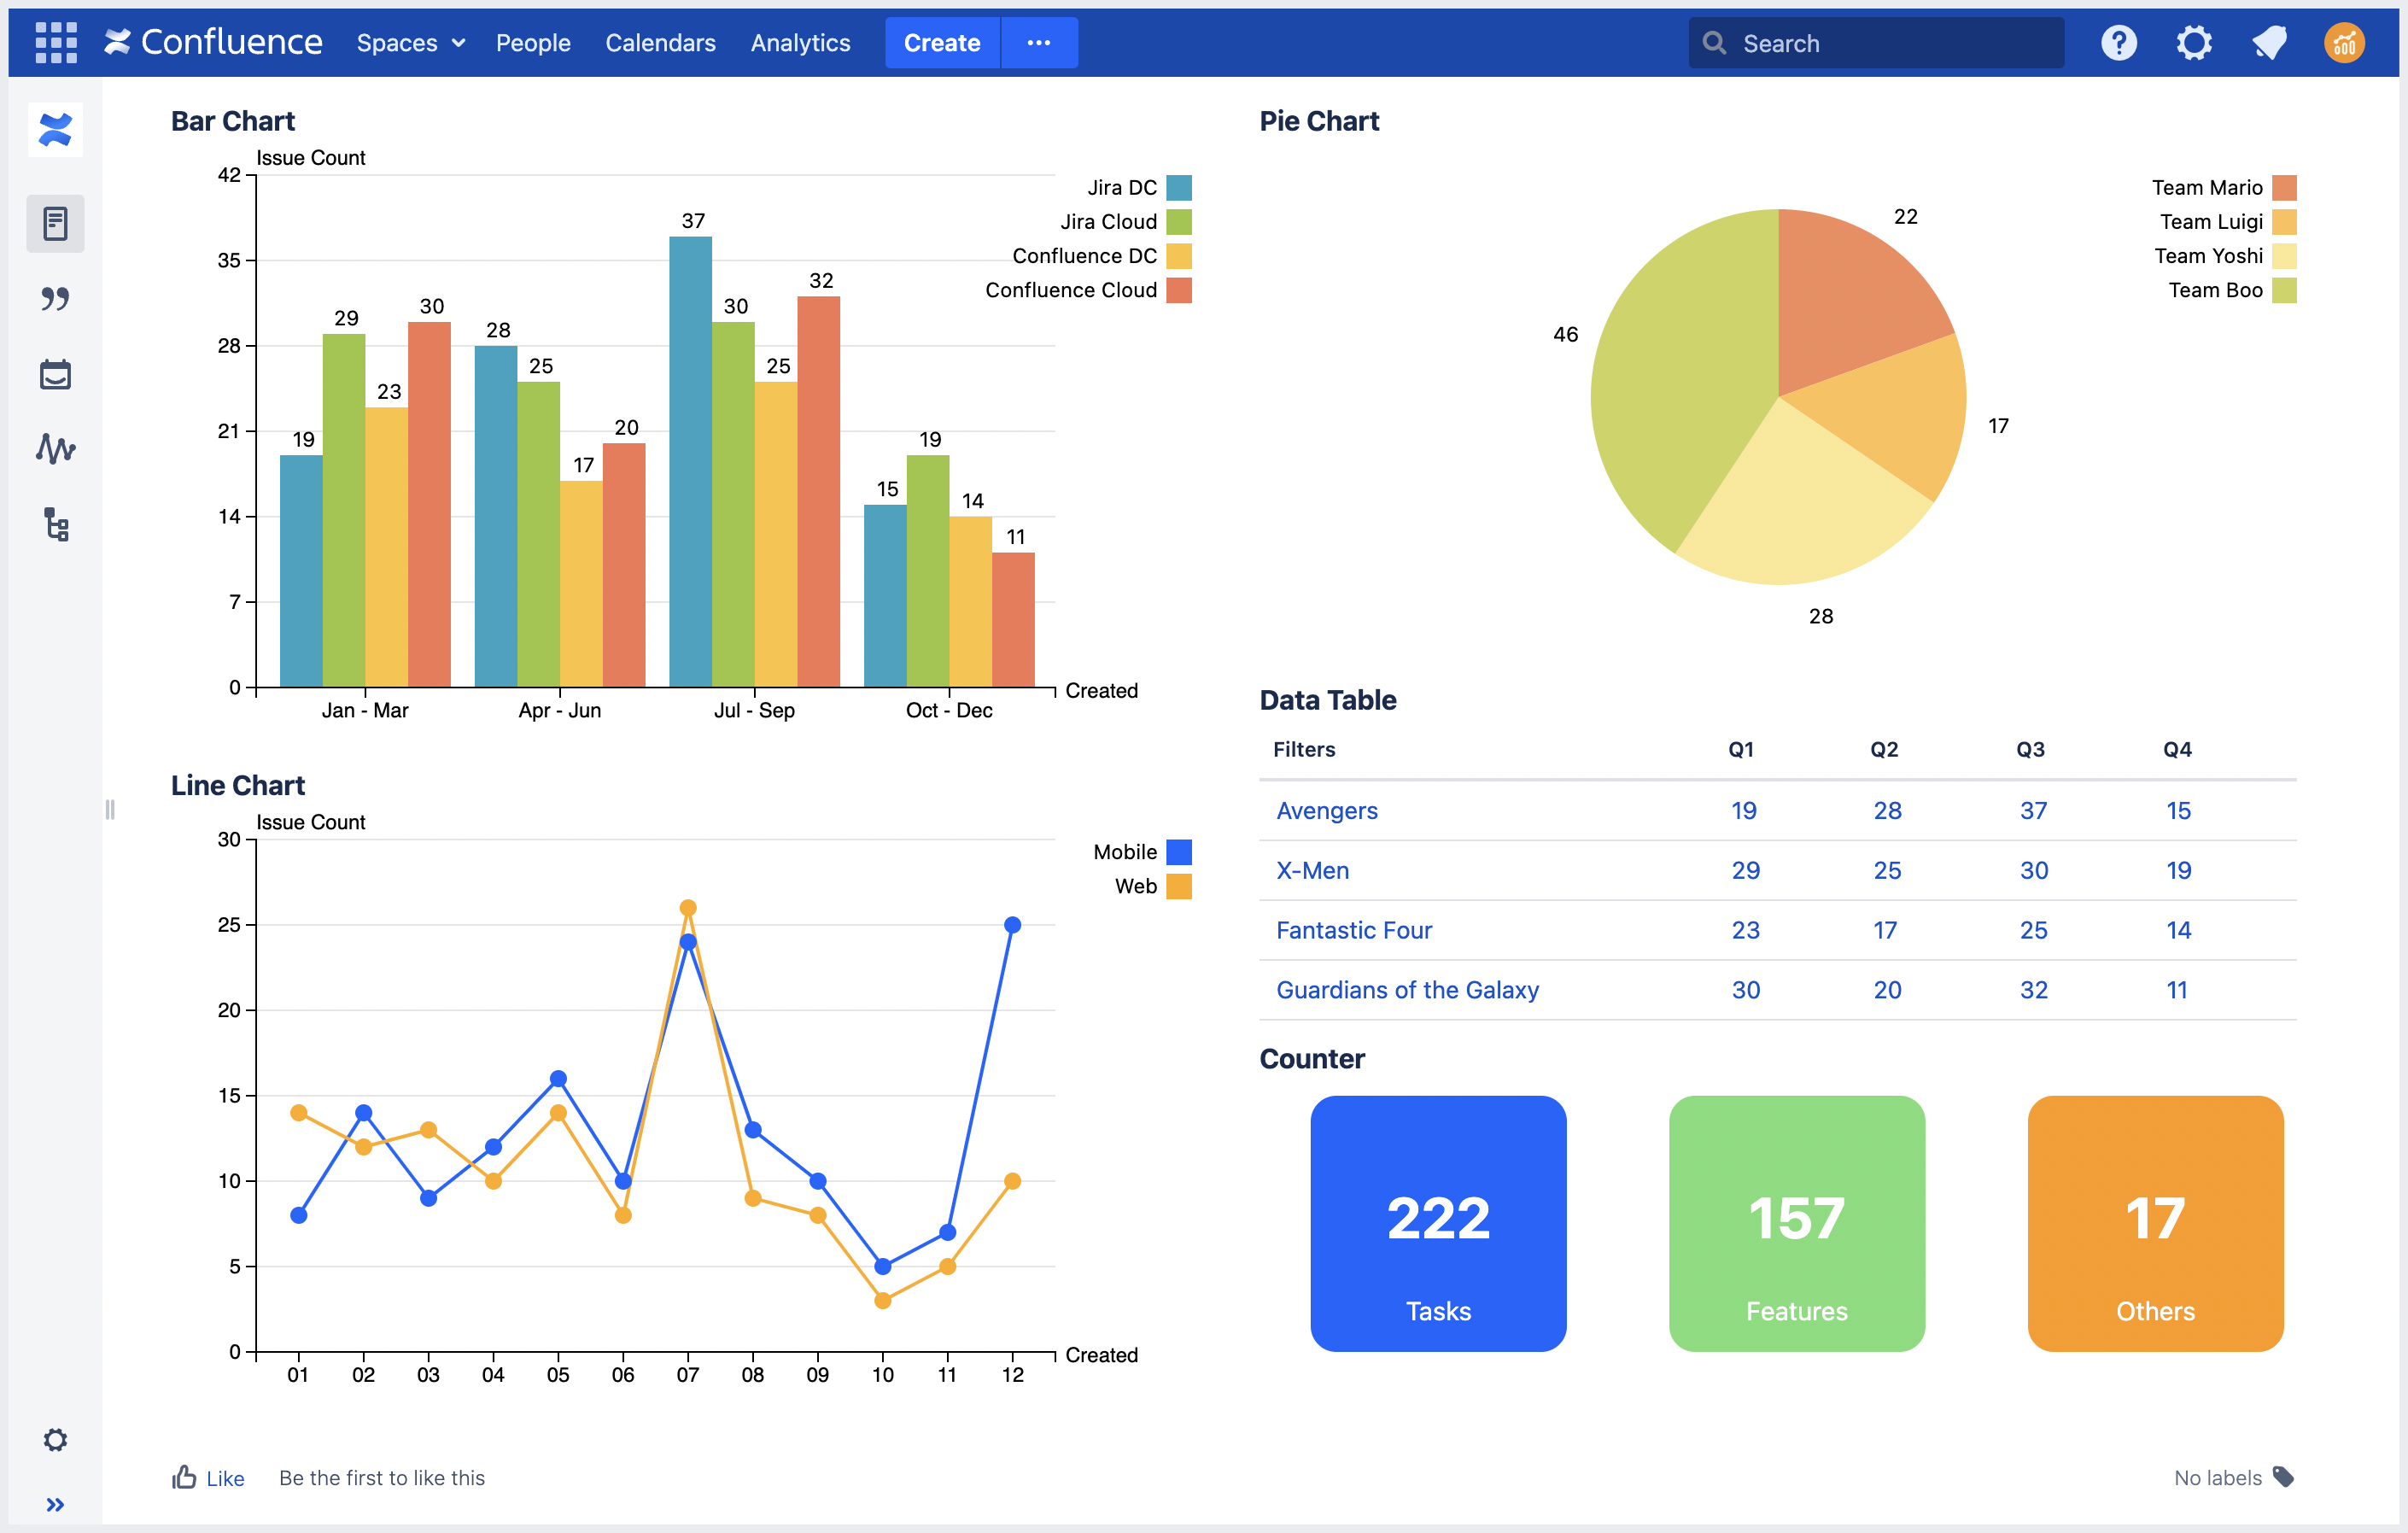
Multiple Filters Chart Macros for Confluence allows you to visualise data from your Jira issues.
Instead of adding external gadgets, you can use the macros directly in your Confluence.
10 macros available
📊 Bar Chart
🟡 Pie Chart
🔢 Counter
5 types of data visualisation
Visualise Jira issues data with bar chart, line chart, pie chart, data table or counter board in your Confluence pages.
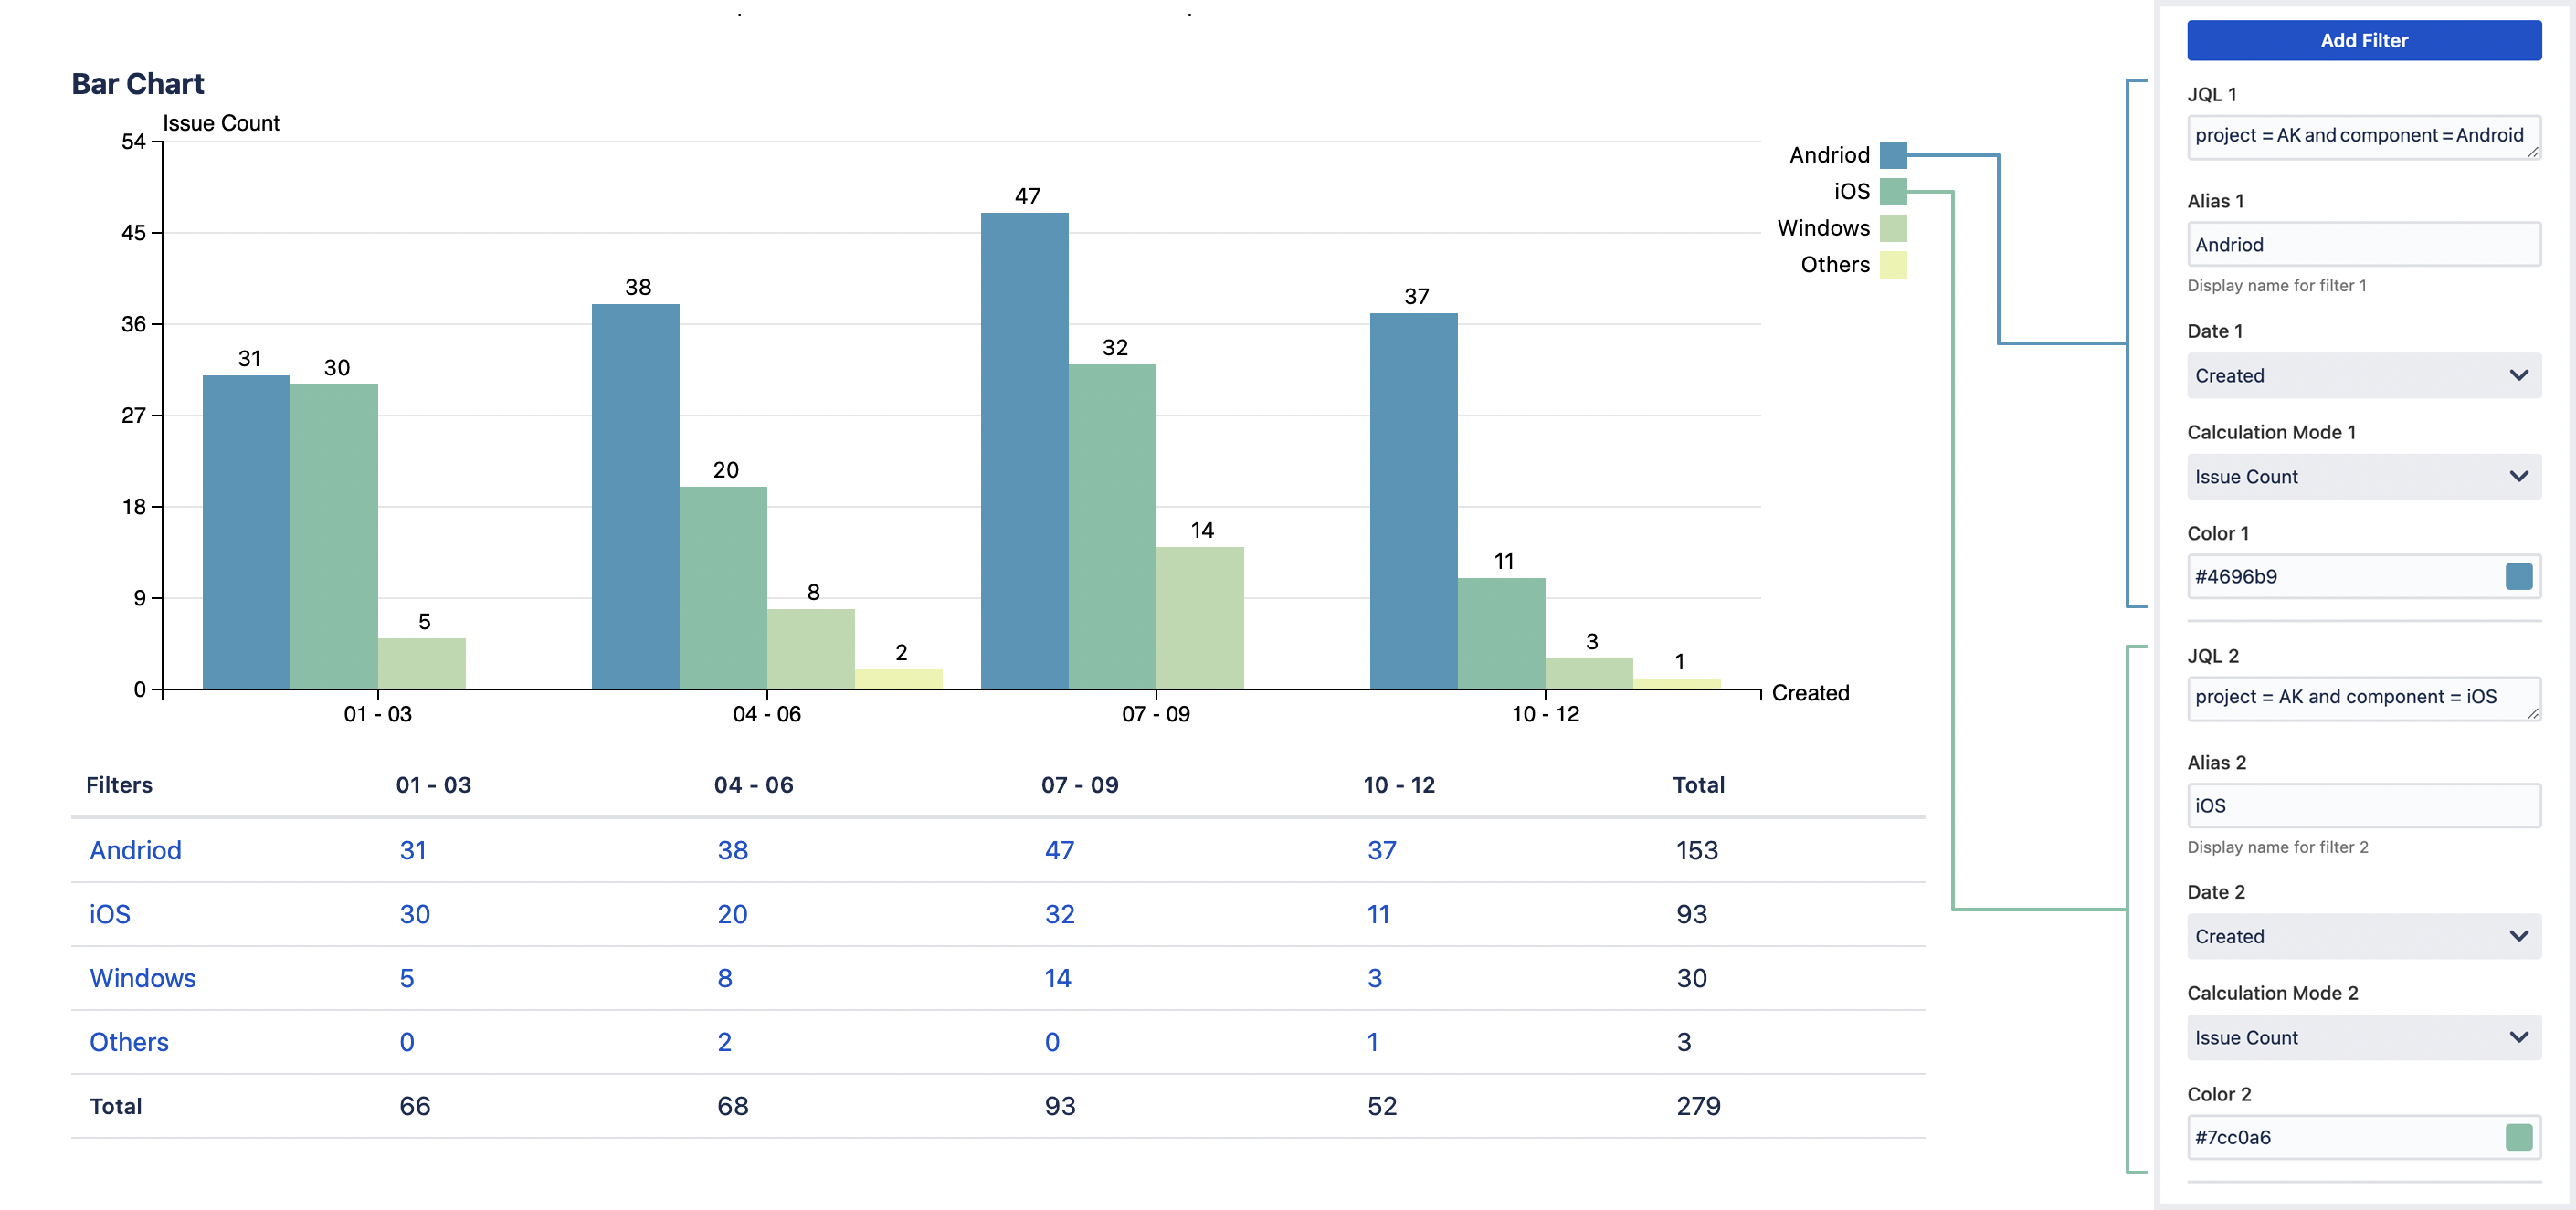
Combine multiple JQL into one
Add up to 12 JQL in a macro. Choose to display chart only, data table only or both.
Various customisation options
Various options are available in each macro for customisation.
For example:
-
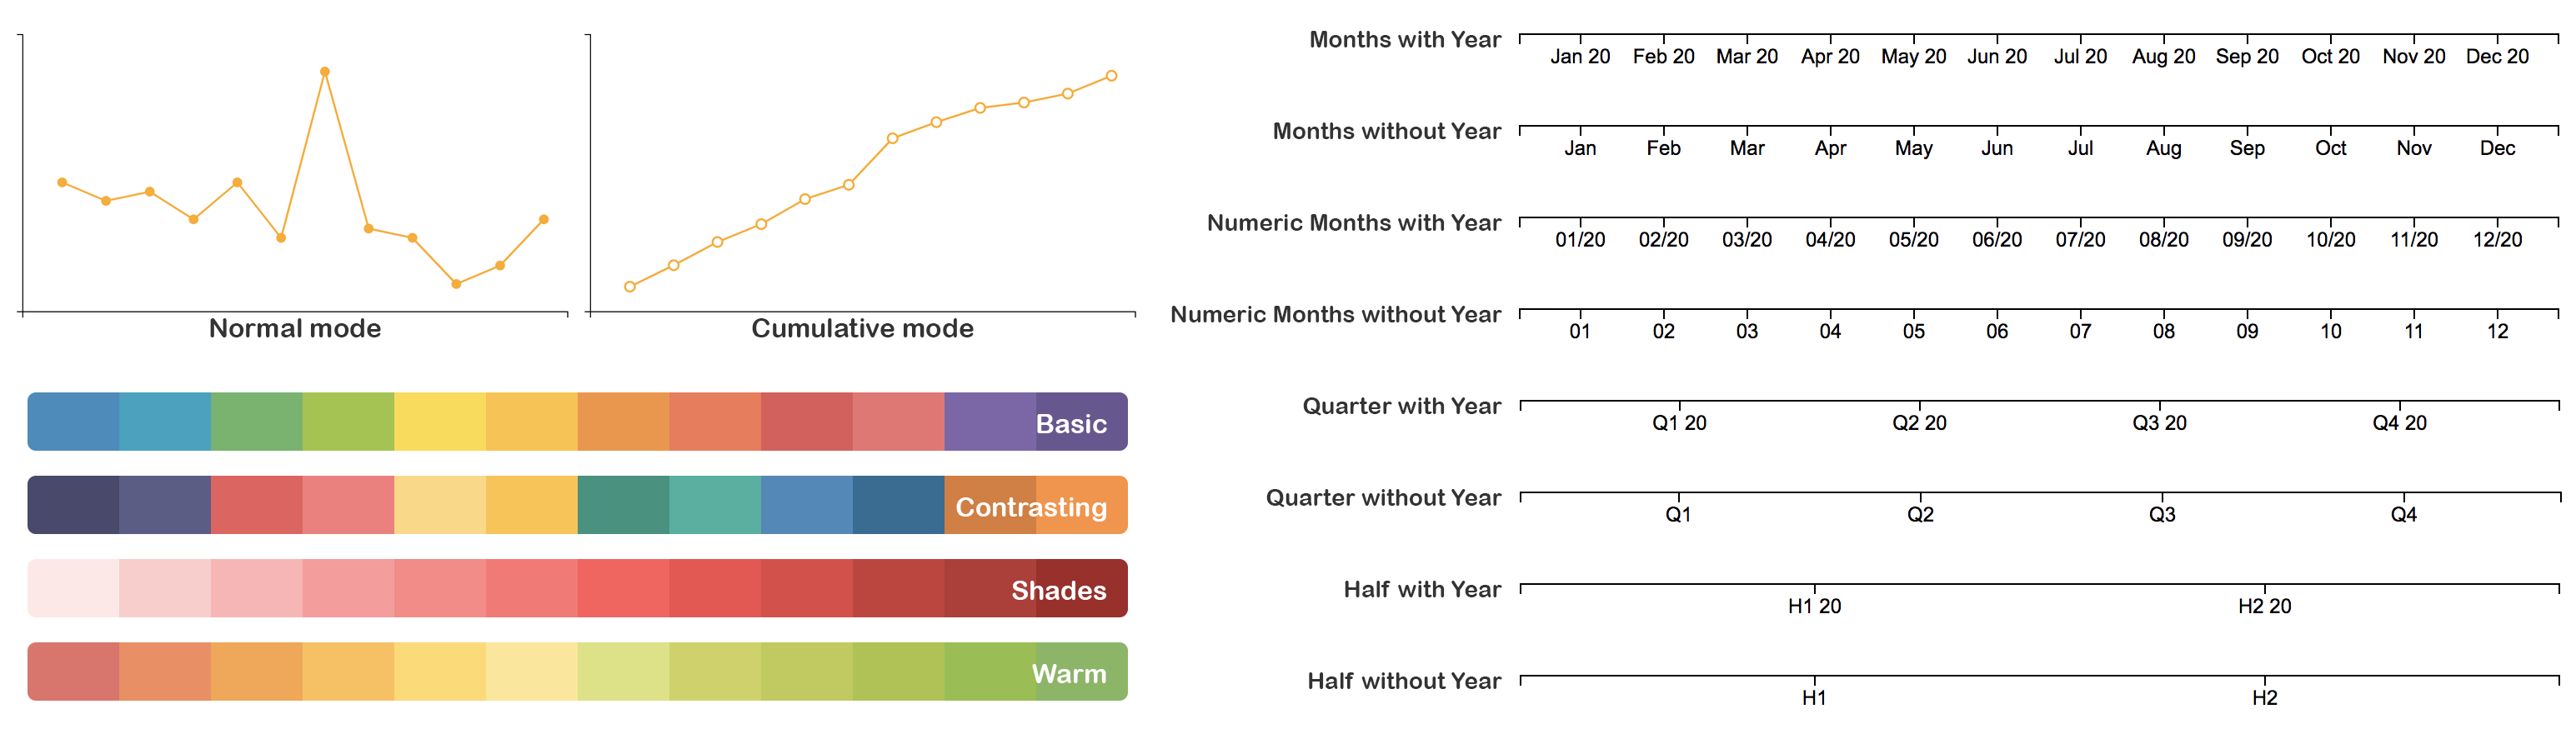
Display chart in normal or cumulative mode
-
Choose from the 4 predefined color schemes or customise your own
-
Select your preferred period format