.png)
Introduction
Multiple Filters Counter Gadget allows multiple counters to be displayed within a single Jira gadget.
It gives teams a fast, compact way to monitor key metrics side by side. Instead of opening several filters, boards, or reports, users can see the current count for each important work category in one place.
An Real Life Example on how we use it
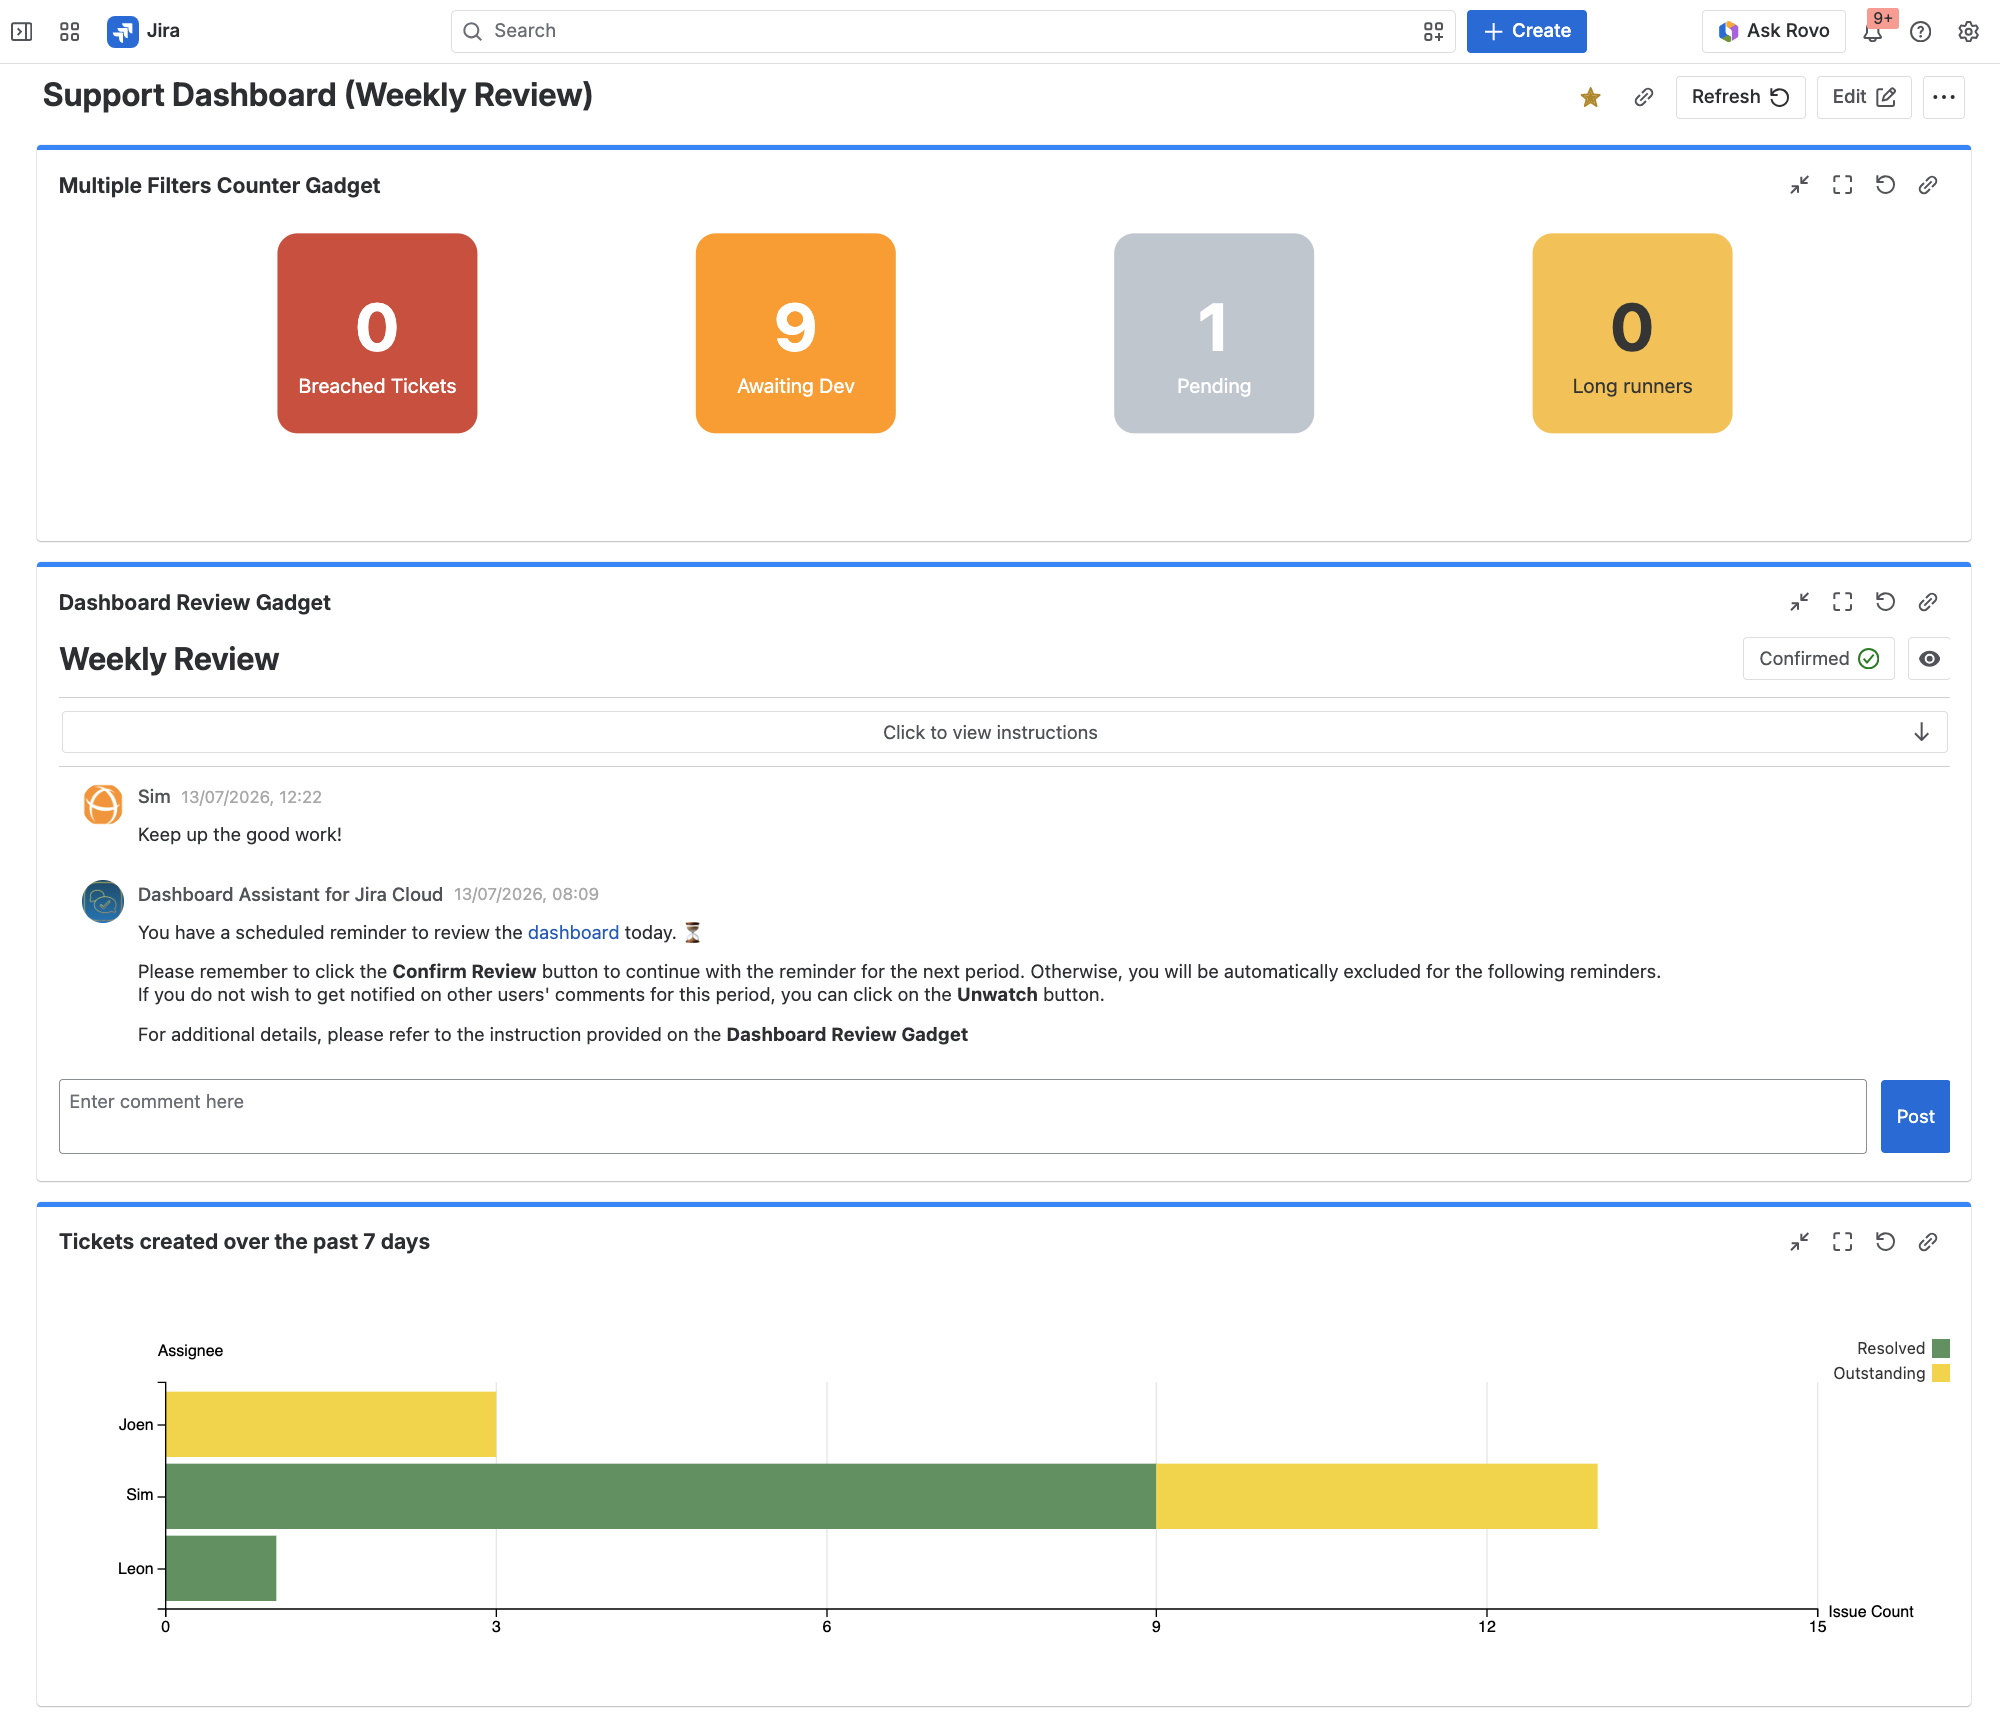
We use this dashboard for the weekly review of our support tickets
-
The top row is Multiple Filters Counter Gadget which display the important metrics that we are tracking
-
The 2nd gadget is the Dashboard Review Gadget which key stakeholders can check-in and discuss on the metrics and key learnings from the past week
-
The bottom gadget is the Multiple Filters Statistic Horizontal Bar Chart Gadget which presents the workload distribution among the support team
You can also use it
Counters are commonly added in dashboards to support many scenarios.
-
Daily stand-ups: To review the number of issues in key states, such as To Do, In Progress, Blocked, and Ready for Release.
-
Support operations: To track open incidents, high-priority requests, overdue tickets, and unassigned support issues.
-
Release management: To monitor unresolved bugs, failed QA items, release blockers, or issues still pending approval.
-
SLA monitoring: To keep an eye on tickets approaching breach or already breached, so teams can act before escalation.
-
Portfolio or management dashboards: To summarise important counts across projects, teams, components, or customers.
-
Personal work tracking: To show assigned issues, items needing review, mentions, or tasks due soon.
In short, people use multiple counters when they need simple, measurable signals that help them decide where to focus attention without digging into Jira searches or reports.