For Jira 7, please use version 1.8.0.
For Jira 8, please use version 2.0.0.
Summary
New Features
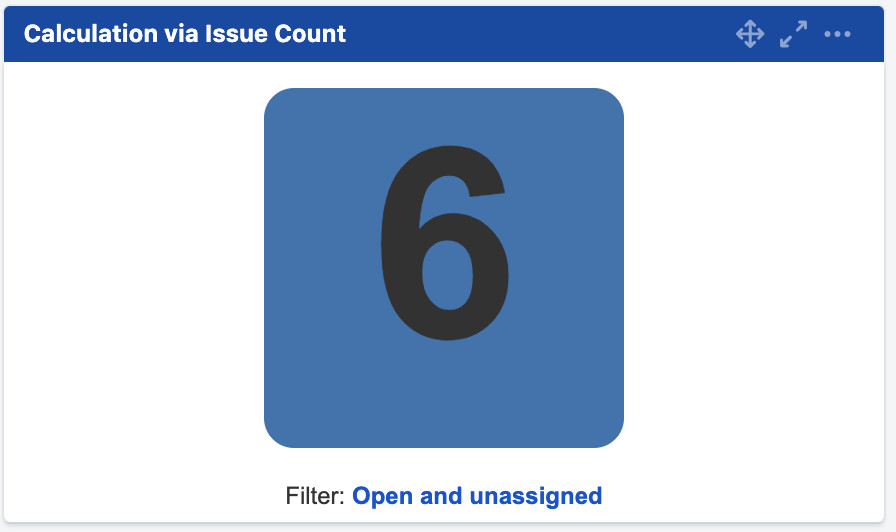
To allow display of issue count or sum of selected custom field values
|
Before |
After |
|---|---|
|
Only Issue count is supported
|
You can also sum values from other numeric fields.
|
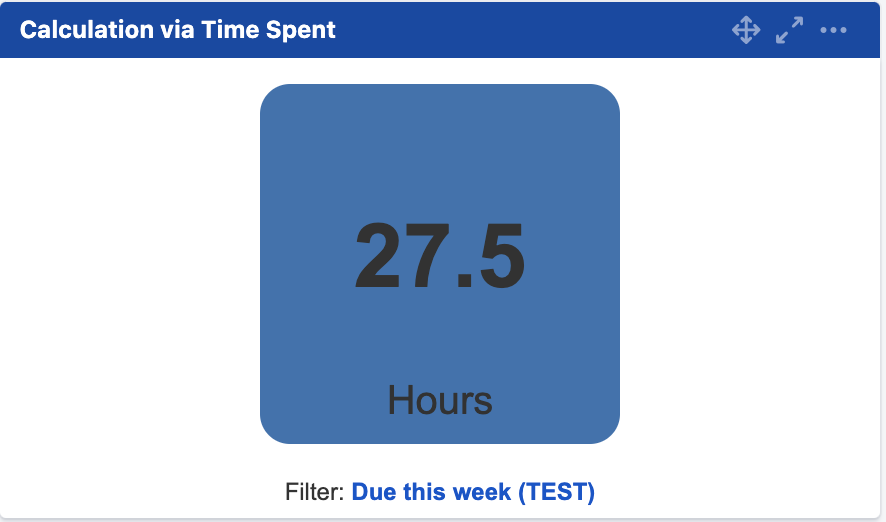
With a new preference "Sum of", you can select how the values are calculated
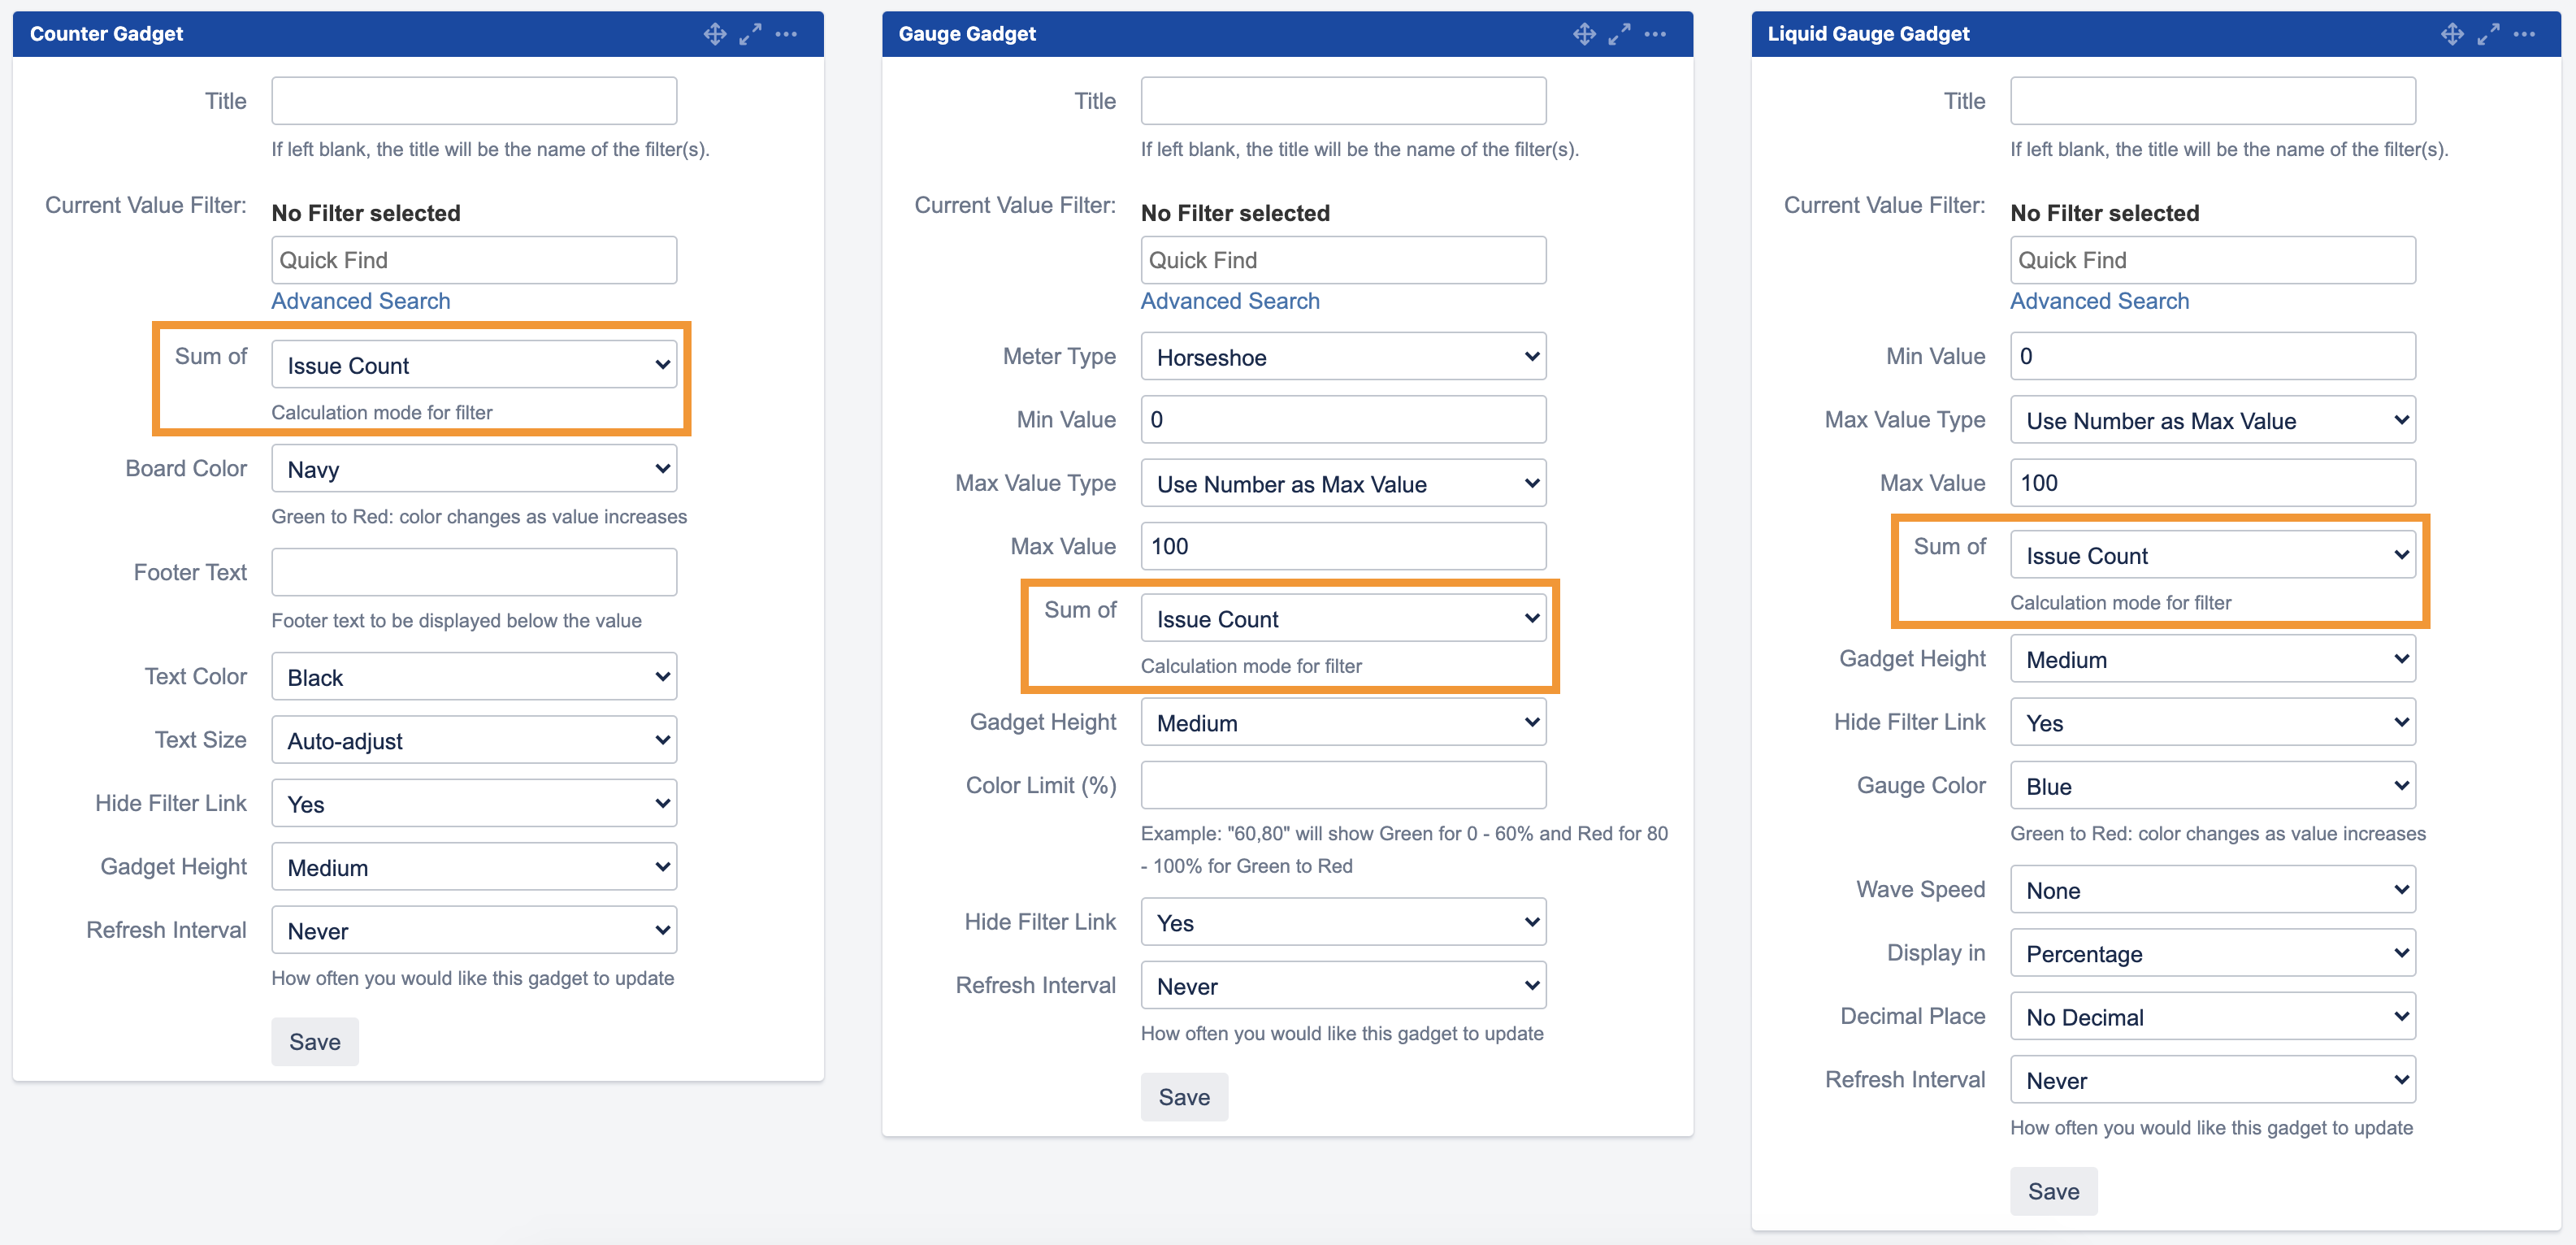
The following options are available
-
Issue count (selected by default)
-
Time Spent
-
Time Estimate
-
Time Original Estimate
-
Custom Number fields
Improvements
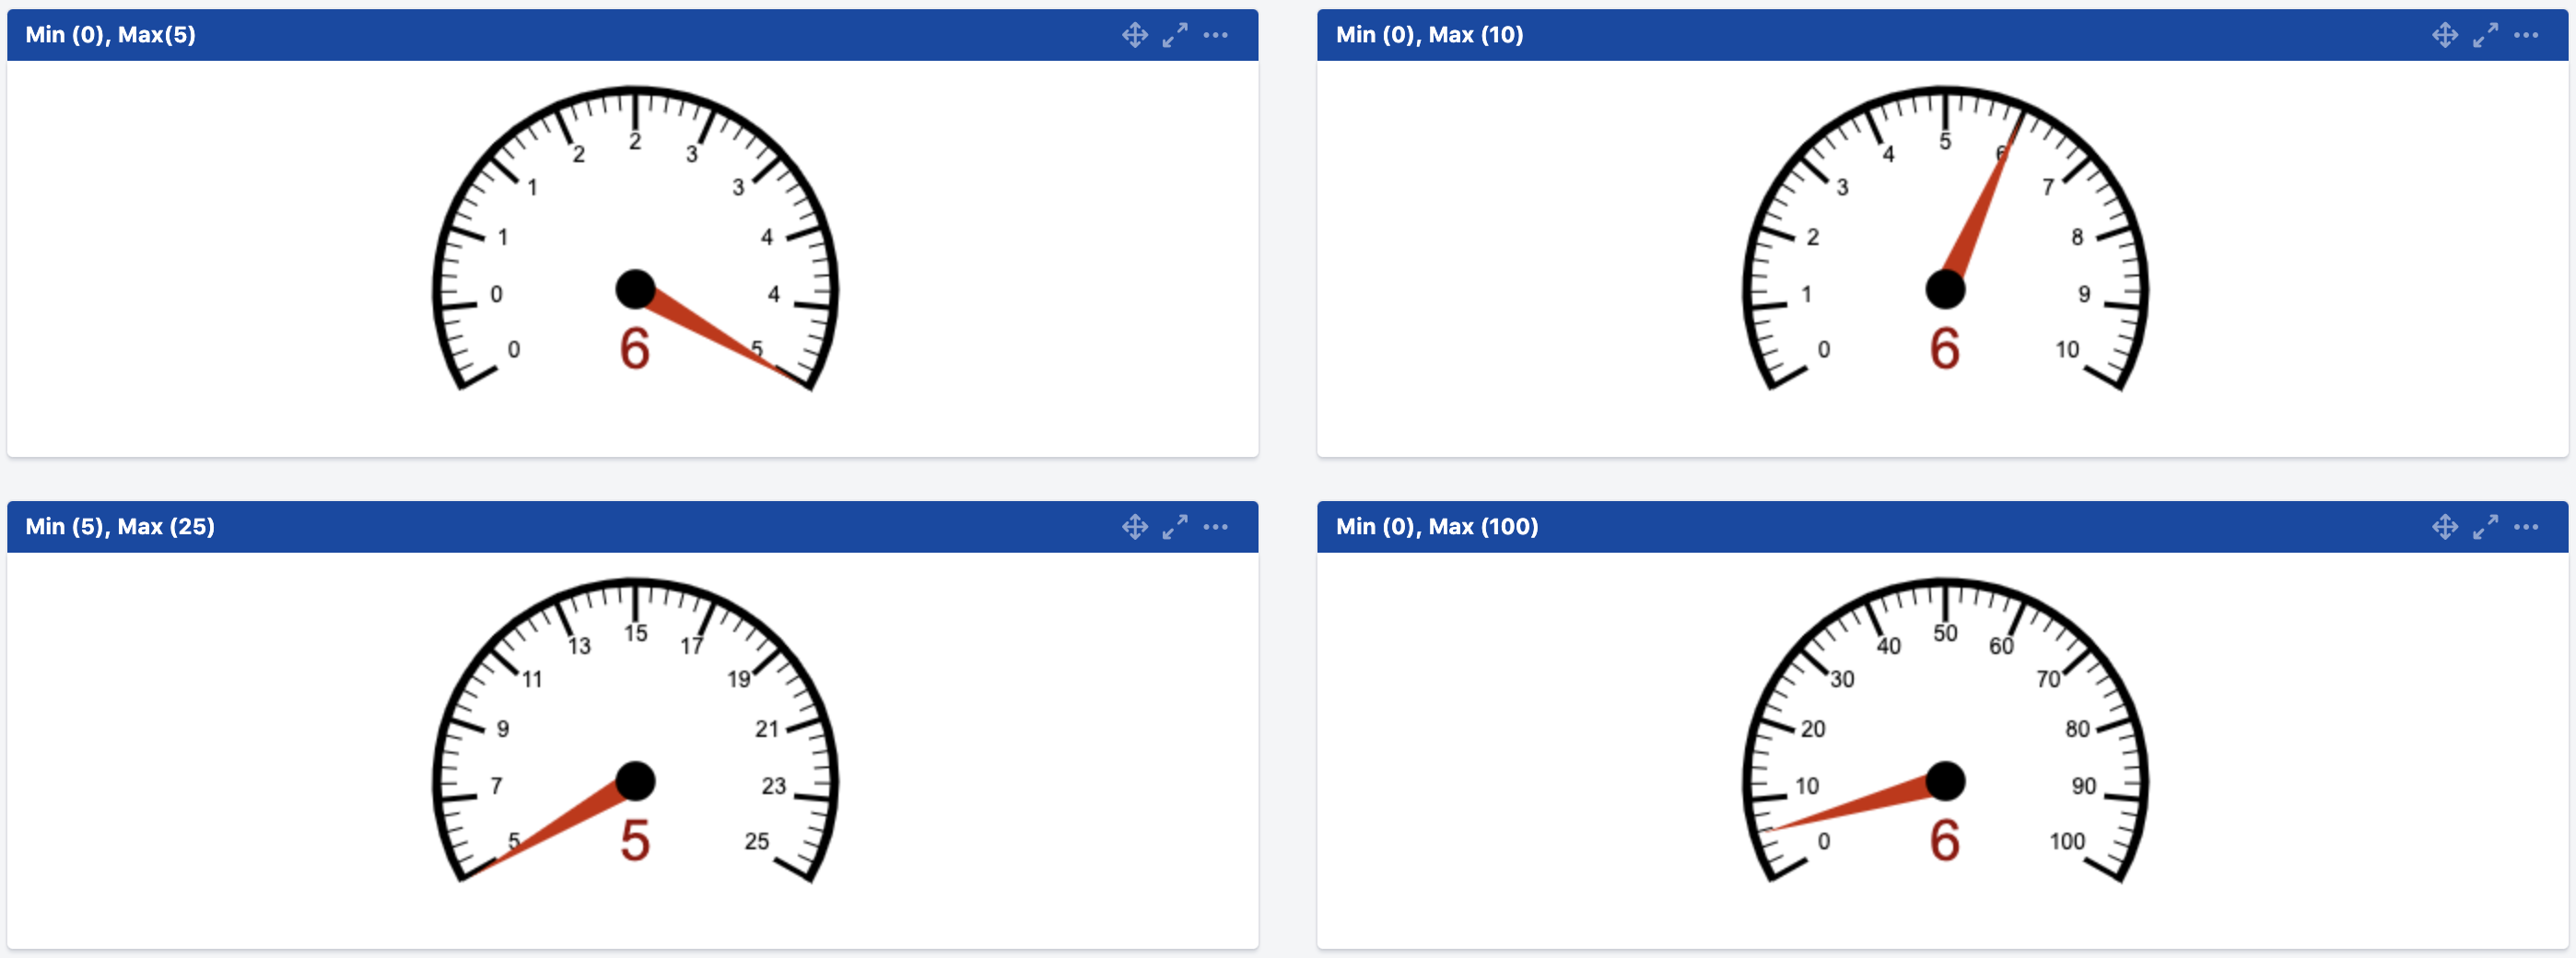
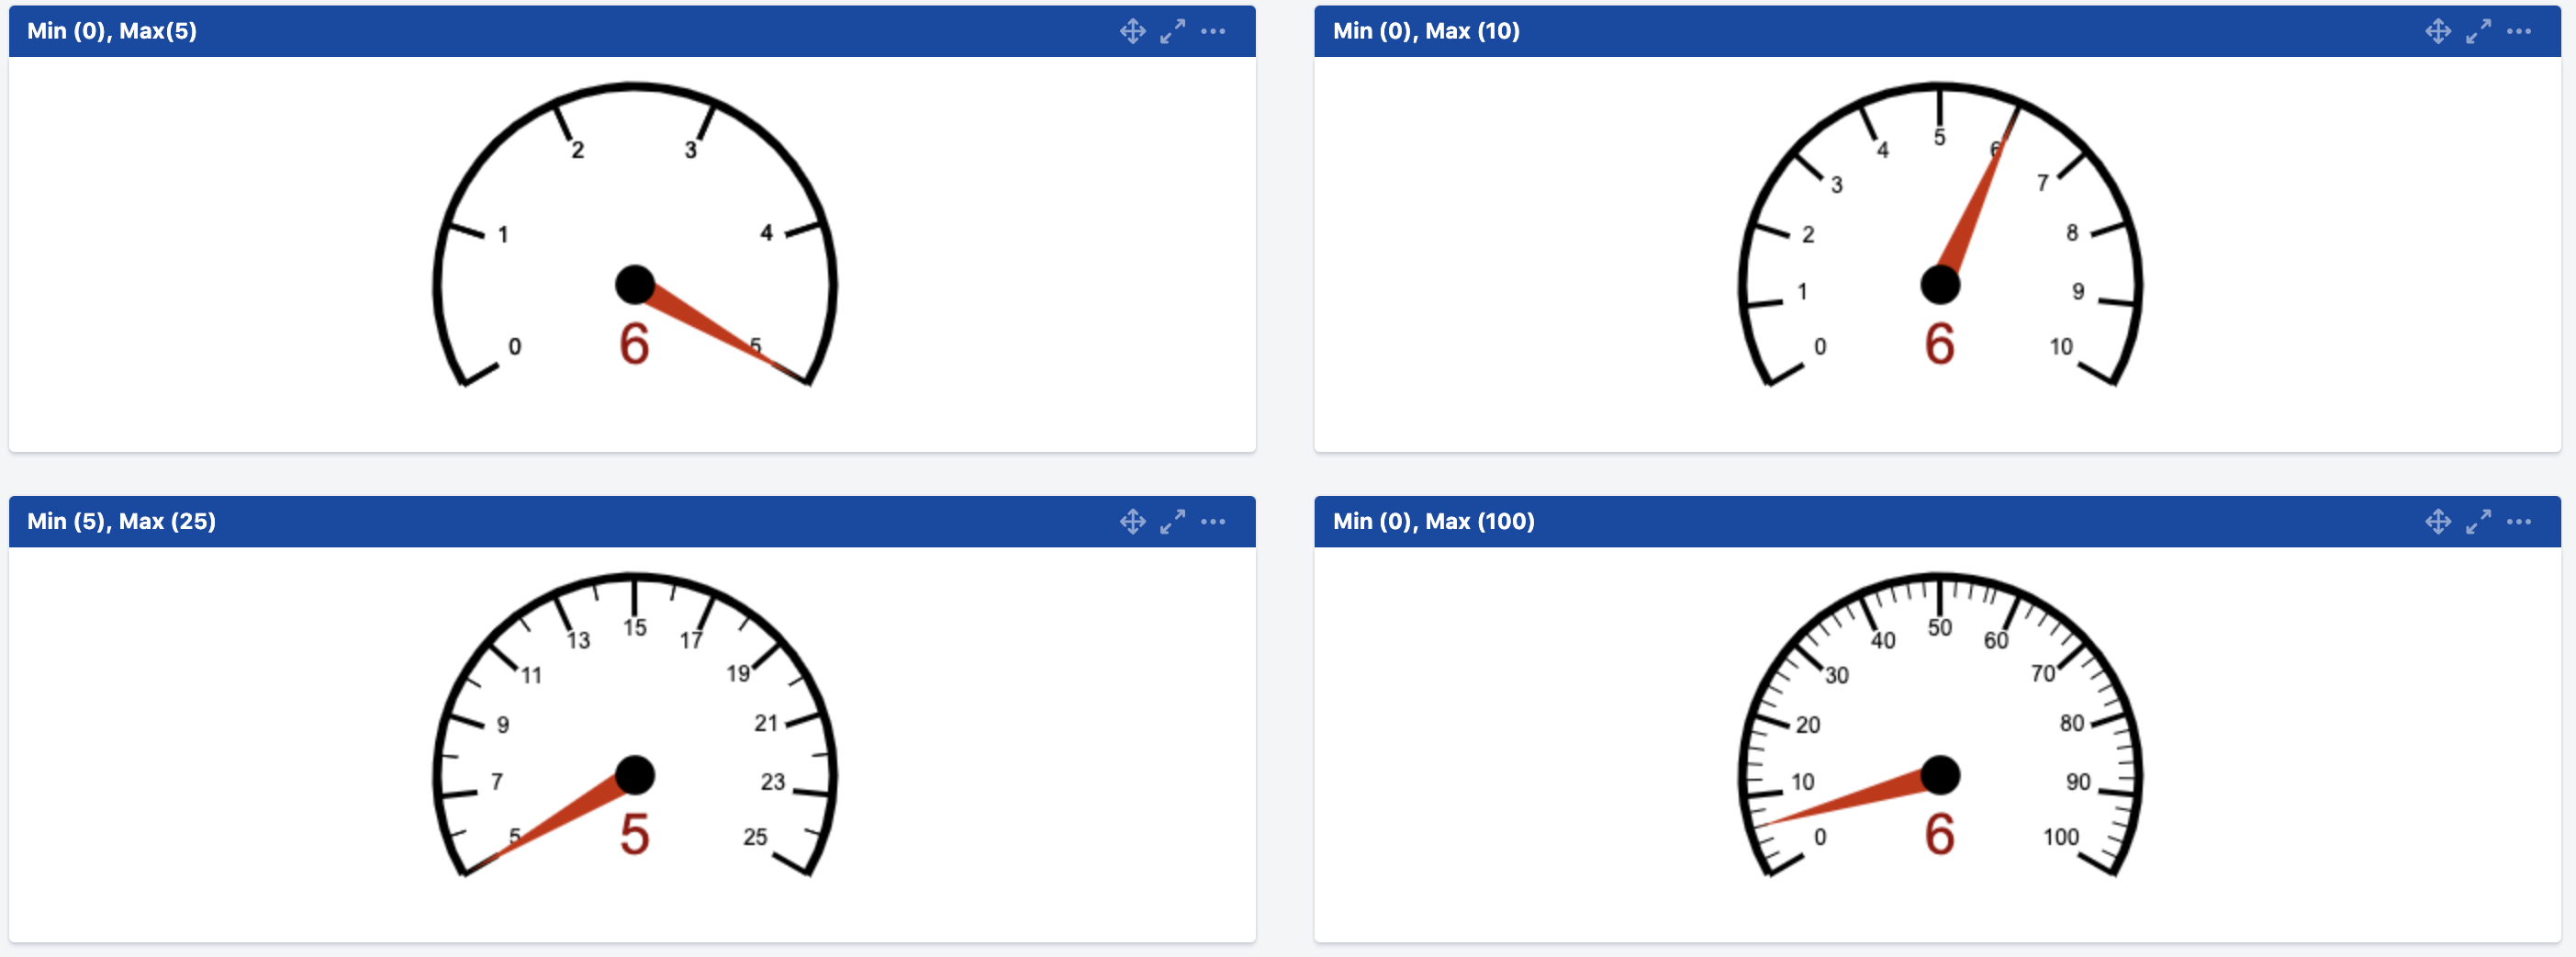
Display for Needle Gauge
Previously, the displayed axis labels which denotes the units between min and max values are fixed.
We've added the flexibility where if the range is greater than 10, the minor labels will be added to the chart. Anything below 10 will only display the Major axis.
|
Before |
|
|---|---|
|
After |
|
Issues