Configure Multiple Filters Statistic Bar Chart Gadget (Vertical)
Overview
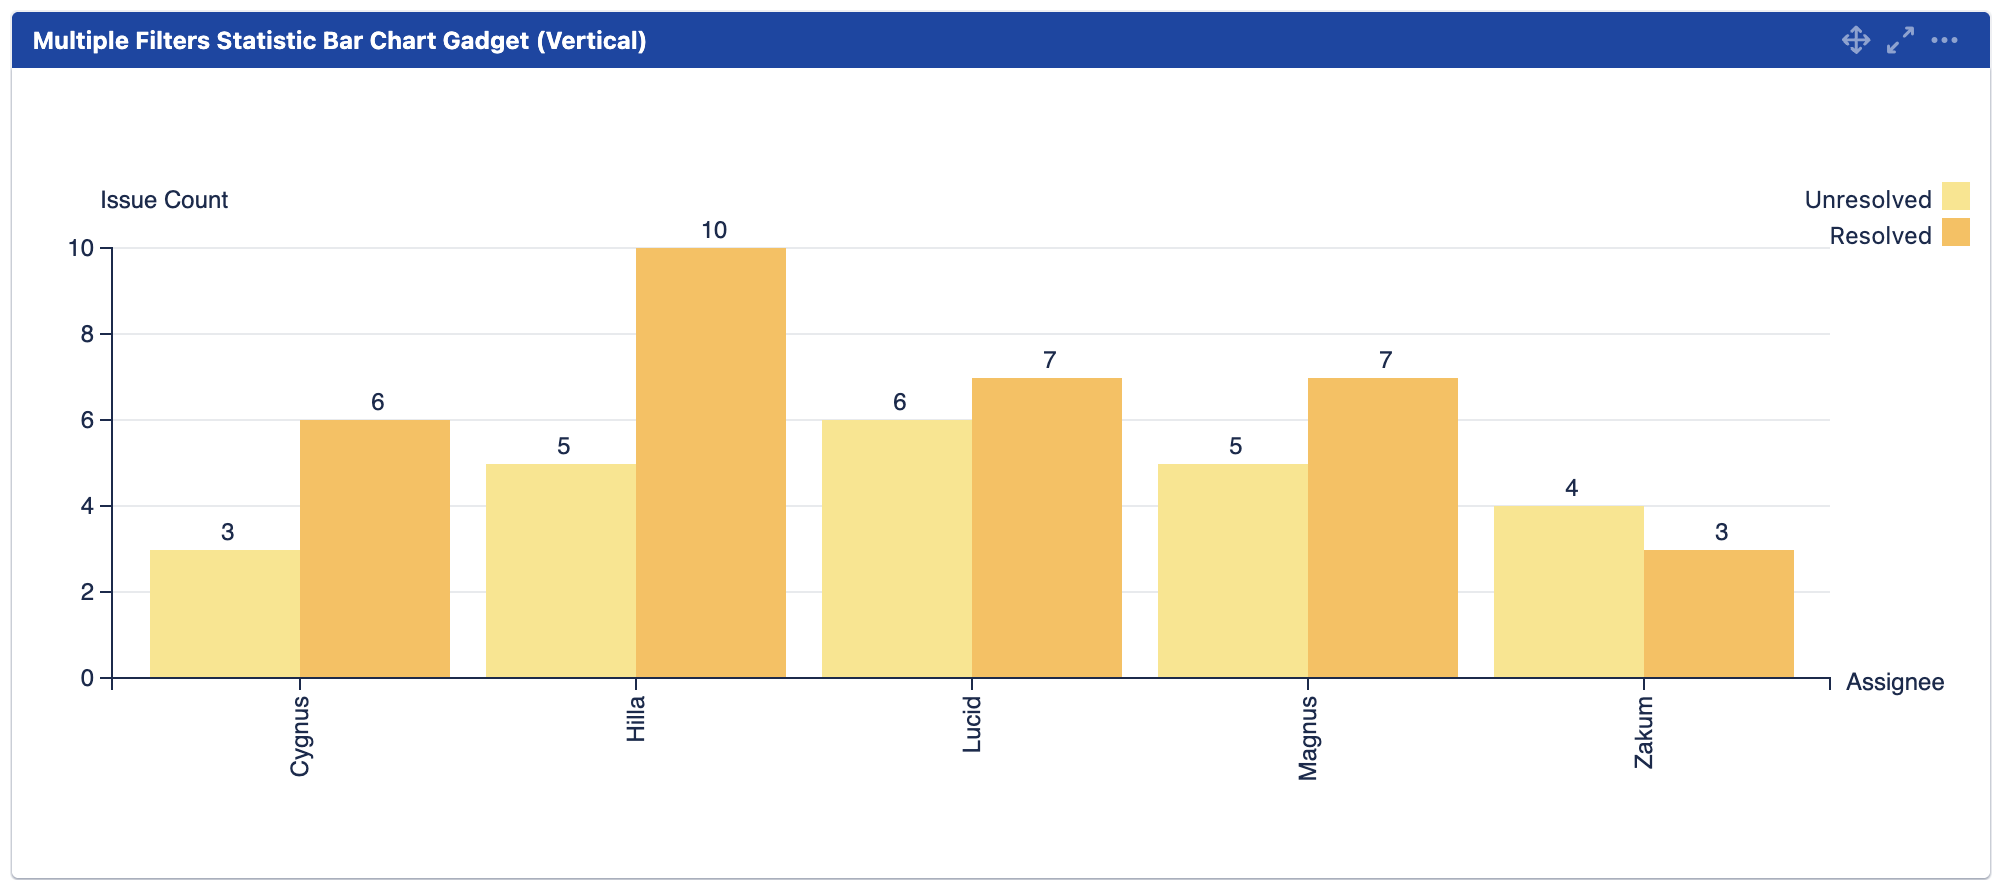
The Multiple Filters Statistic Bar Chart Gadget (Vertical) provides reporting on issues statistics.
Configuration
Settings | Default | Description | |
|---|---|---|---|
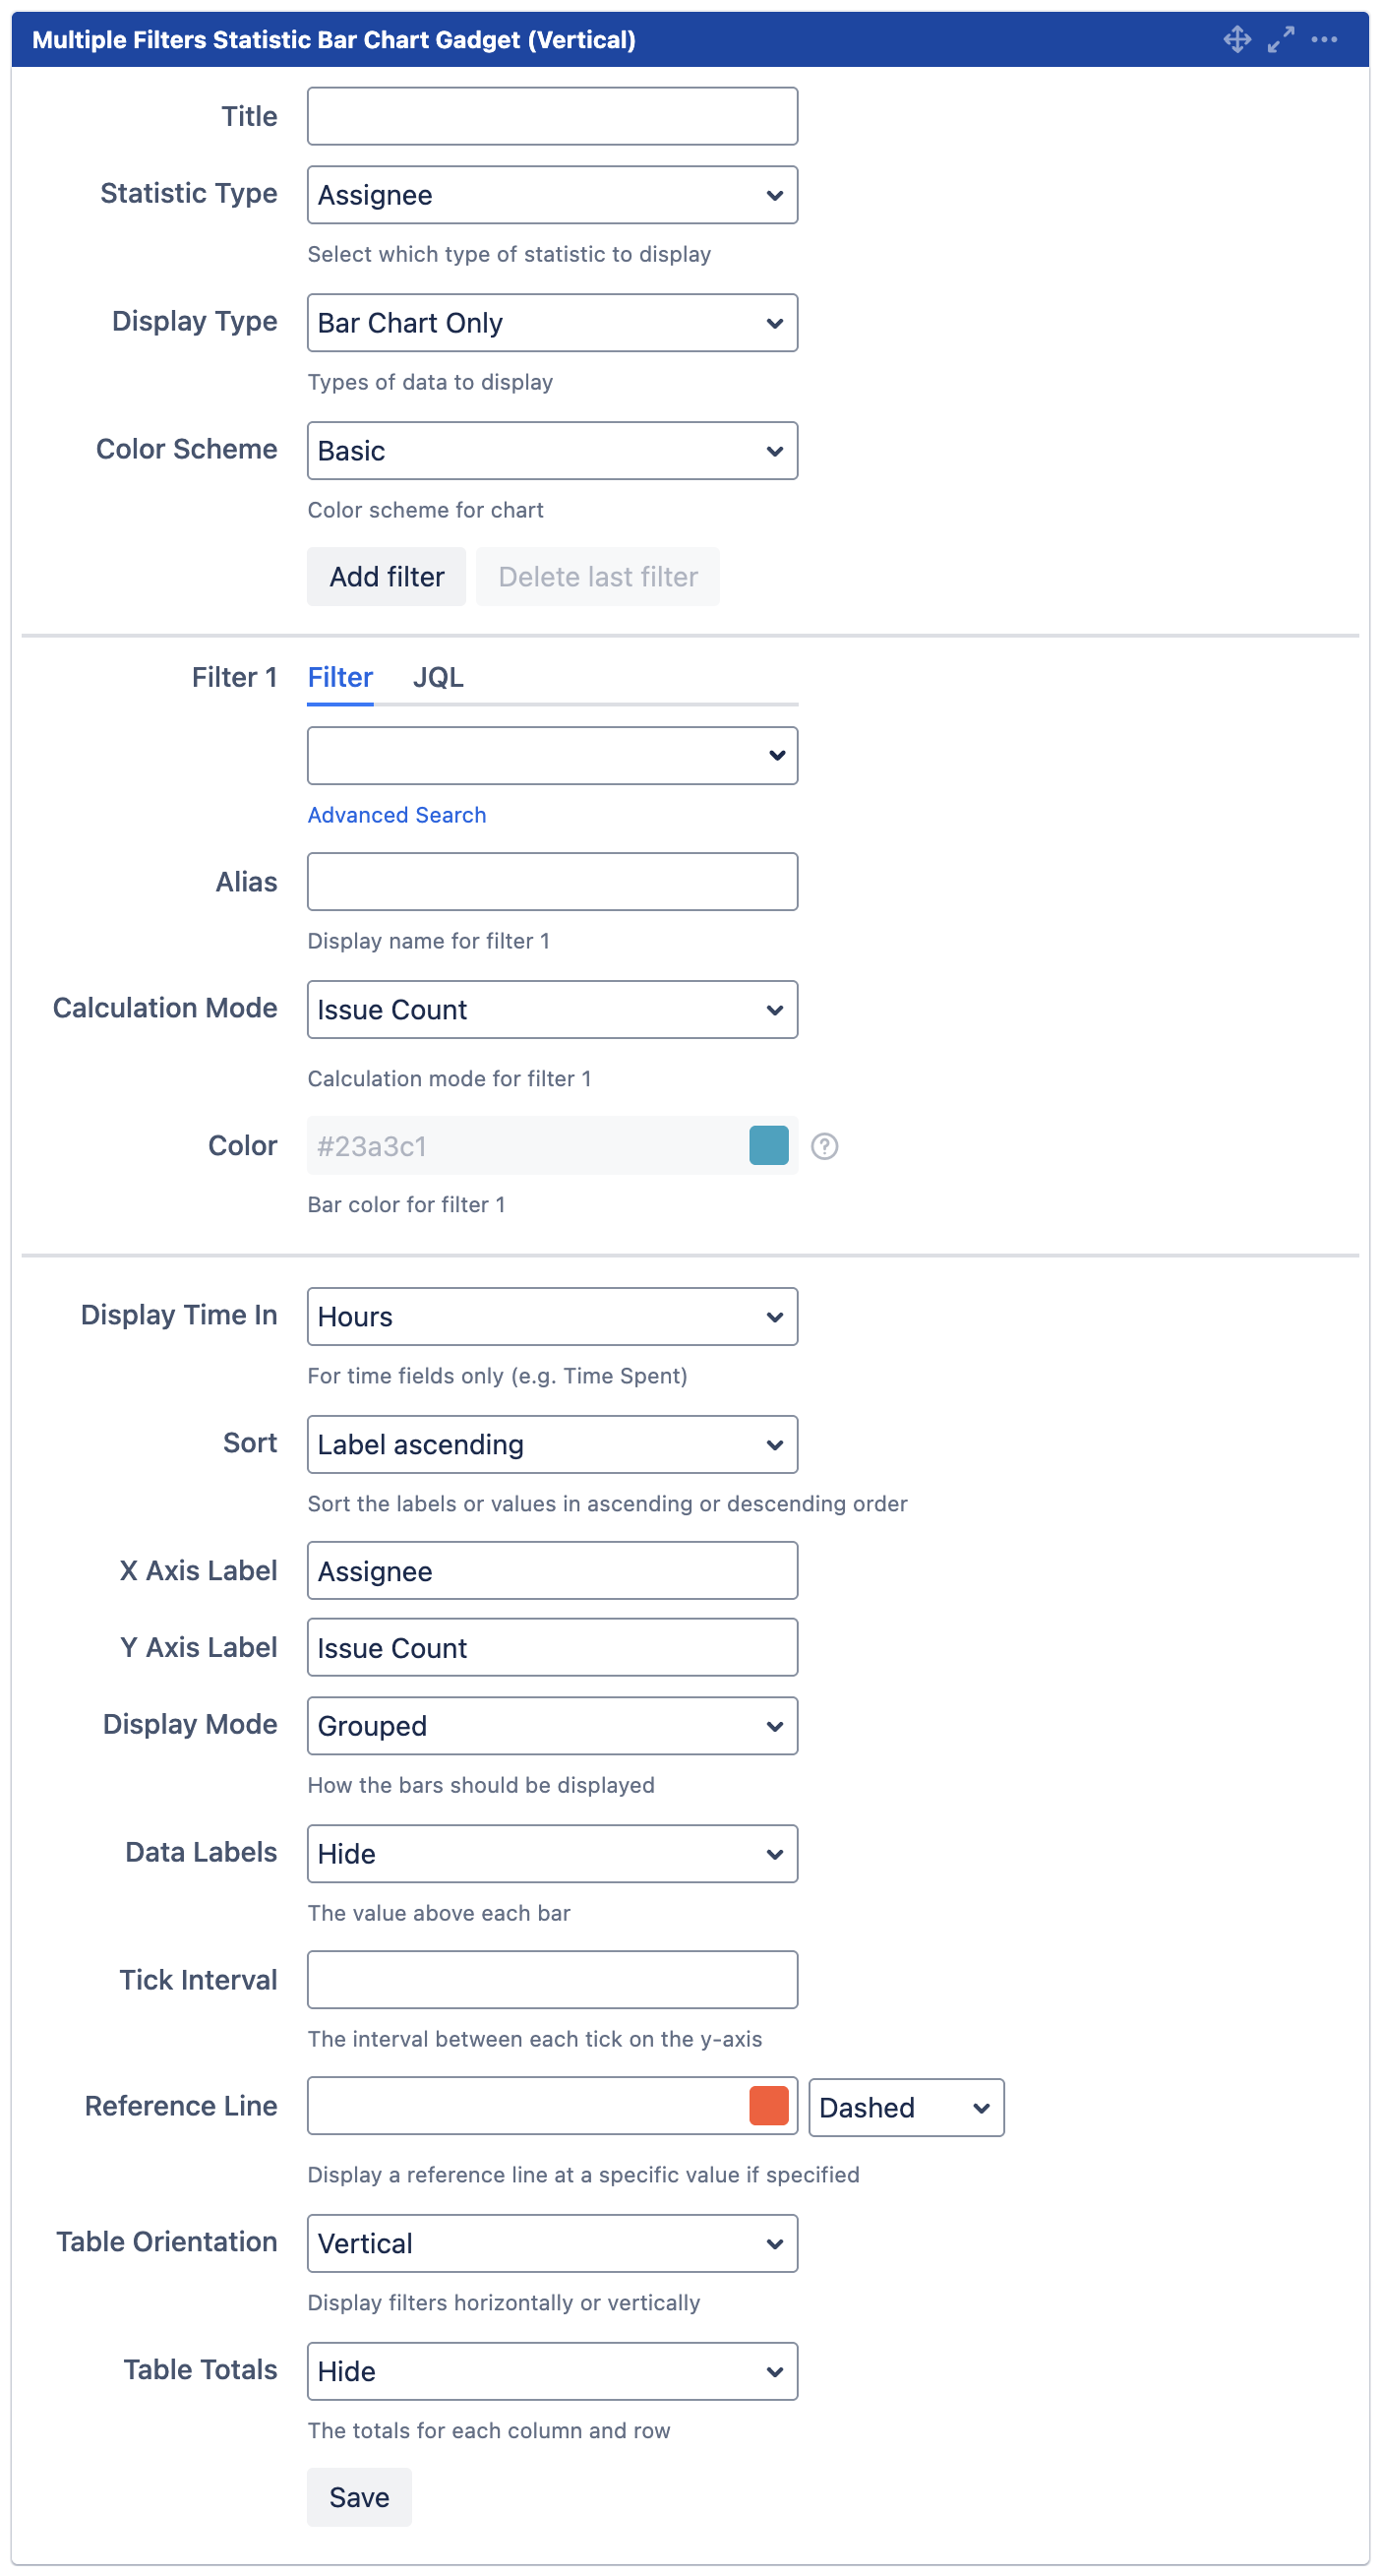
Title | The title of the gadget | ||
Statistic Type | The type of statistic to display | ||
Display Type | Bar Chart Only | The types of data to display:
| |
Color Scheme | Basic | The color scheme for bar chart:
| |
Add filter | Click to add filter *Maximum of 12 filters | ||
Delete last filter | Click to delete last filter | ||
Filter n | Select filter or enter JQL | ||
Alias | The display name for filter n | ||
Calculation Mode | Issue Count | The calculation mode for filter n:
| The operator:
*Not applicable for Issue Count and Same as Filter 1 |
Color | The bar color for filter n *Configurable only if Color Scheme is set to Custom | ||
Display Time In | Hours | The unit to display time in:
*Applicable for Time Fields only (e.g. Time Spent) | |
Sort | Label ascending | Sort the labels or values in ascending or descending order:
| |
X Axis Label | Assignee | The x-axis label for the chart | |
Y Axis Label | Issue Count | The y-axis label for the chart | |
Display Mode | Grouped | How the bars for each filter should be displayed:
| |
Data Labels | Hide | Whether to show/hide the value for each bar:
| |
Tick Interval | The interval between each tick on the y-axis | ||
The value to display the reference line Click on 🟥 to change reference line color | The reference line style:
| ||
Table Orientation | Vertical | Whether to display filters horizontally or vertically:
| |
Table Totals | Hide | The totals for each column and row:
| |