Workaround for 'ERR_INSUFFICIENT_RESOURCES' Error in Jira Dashboards
Background
When users has multiple gadgets on a dashboard, multiple reloads are required for the gadgets to display properly.
Two ways to spot this error:
The console logs shows that a large amounts of request results in
Failed to load resource: net::ERR_INSUFFICIENT_RESOURCES
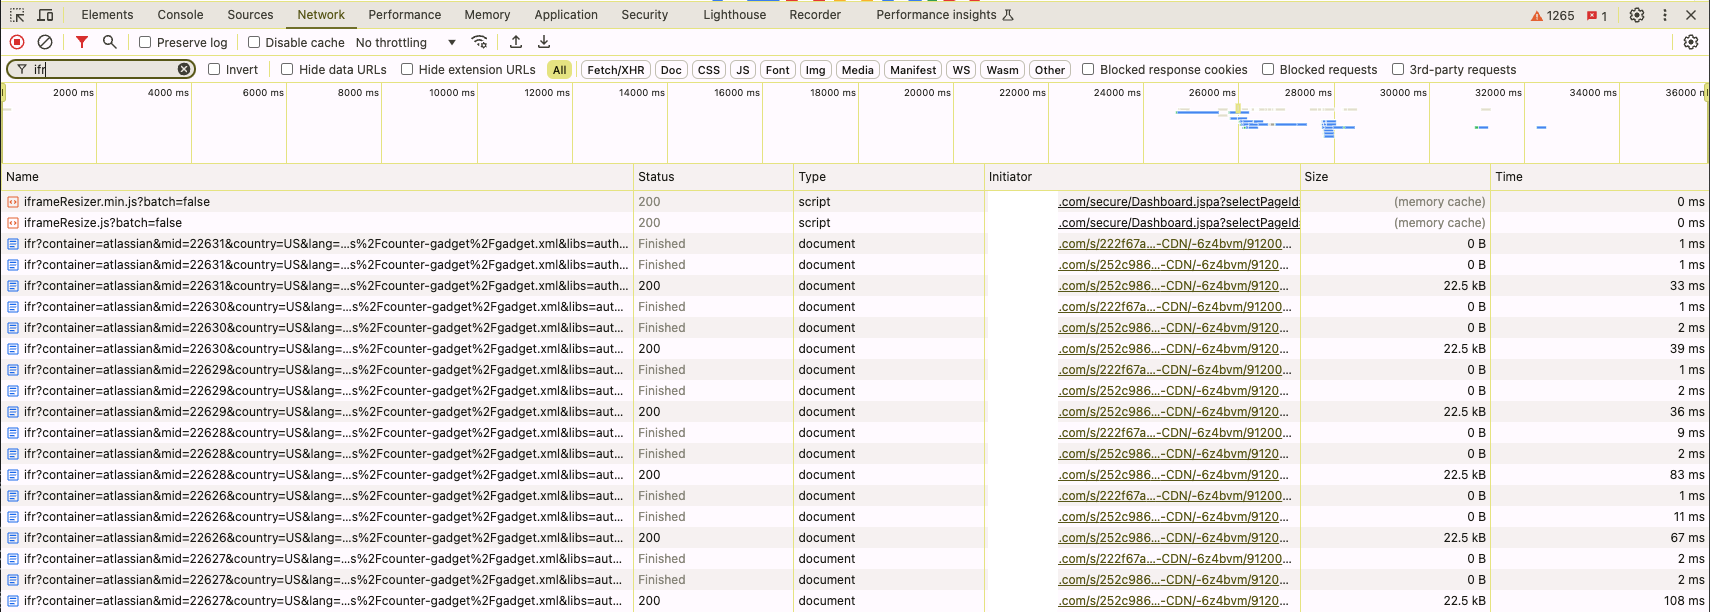
The network logs shows that the gadget has finished running but unable to see the results in the gadgets.

Root Cause
This is a known issue for Jira and also occurs with Atlassian gadgets (e.g. heatmap).
When loading a JIRA Dashboard page, if gadgets are present the browser will make a high number of requests to server for the webresources (CSS, JS) to load the results so the number of web requests can significantly increase dependent on the higher number of gadgets.
Possible results seen in the console logs and network tab are:
For the (failed) status requests, this is likely due to the chrome not being able to handle the large amount of requests resulting in the error "
Failed to load resource: net::ERR_INSUFFICIENT_RESOURCES".For the (finished) status requests, this is likely due to the chrome not being able to return a status code when there are too many requests.
Possible Workaround
Reload the dashboard again so that it can reuse the cached resources
Reduce or consolidate the number of gadgets on the dashboard
