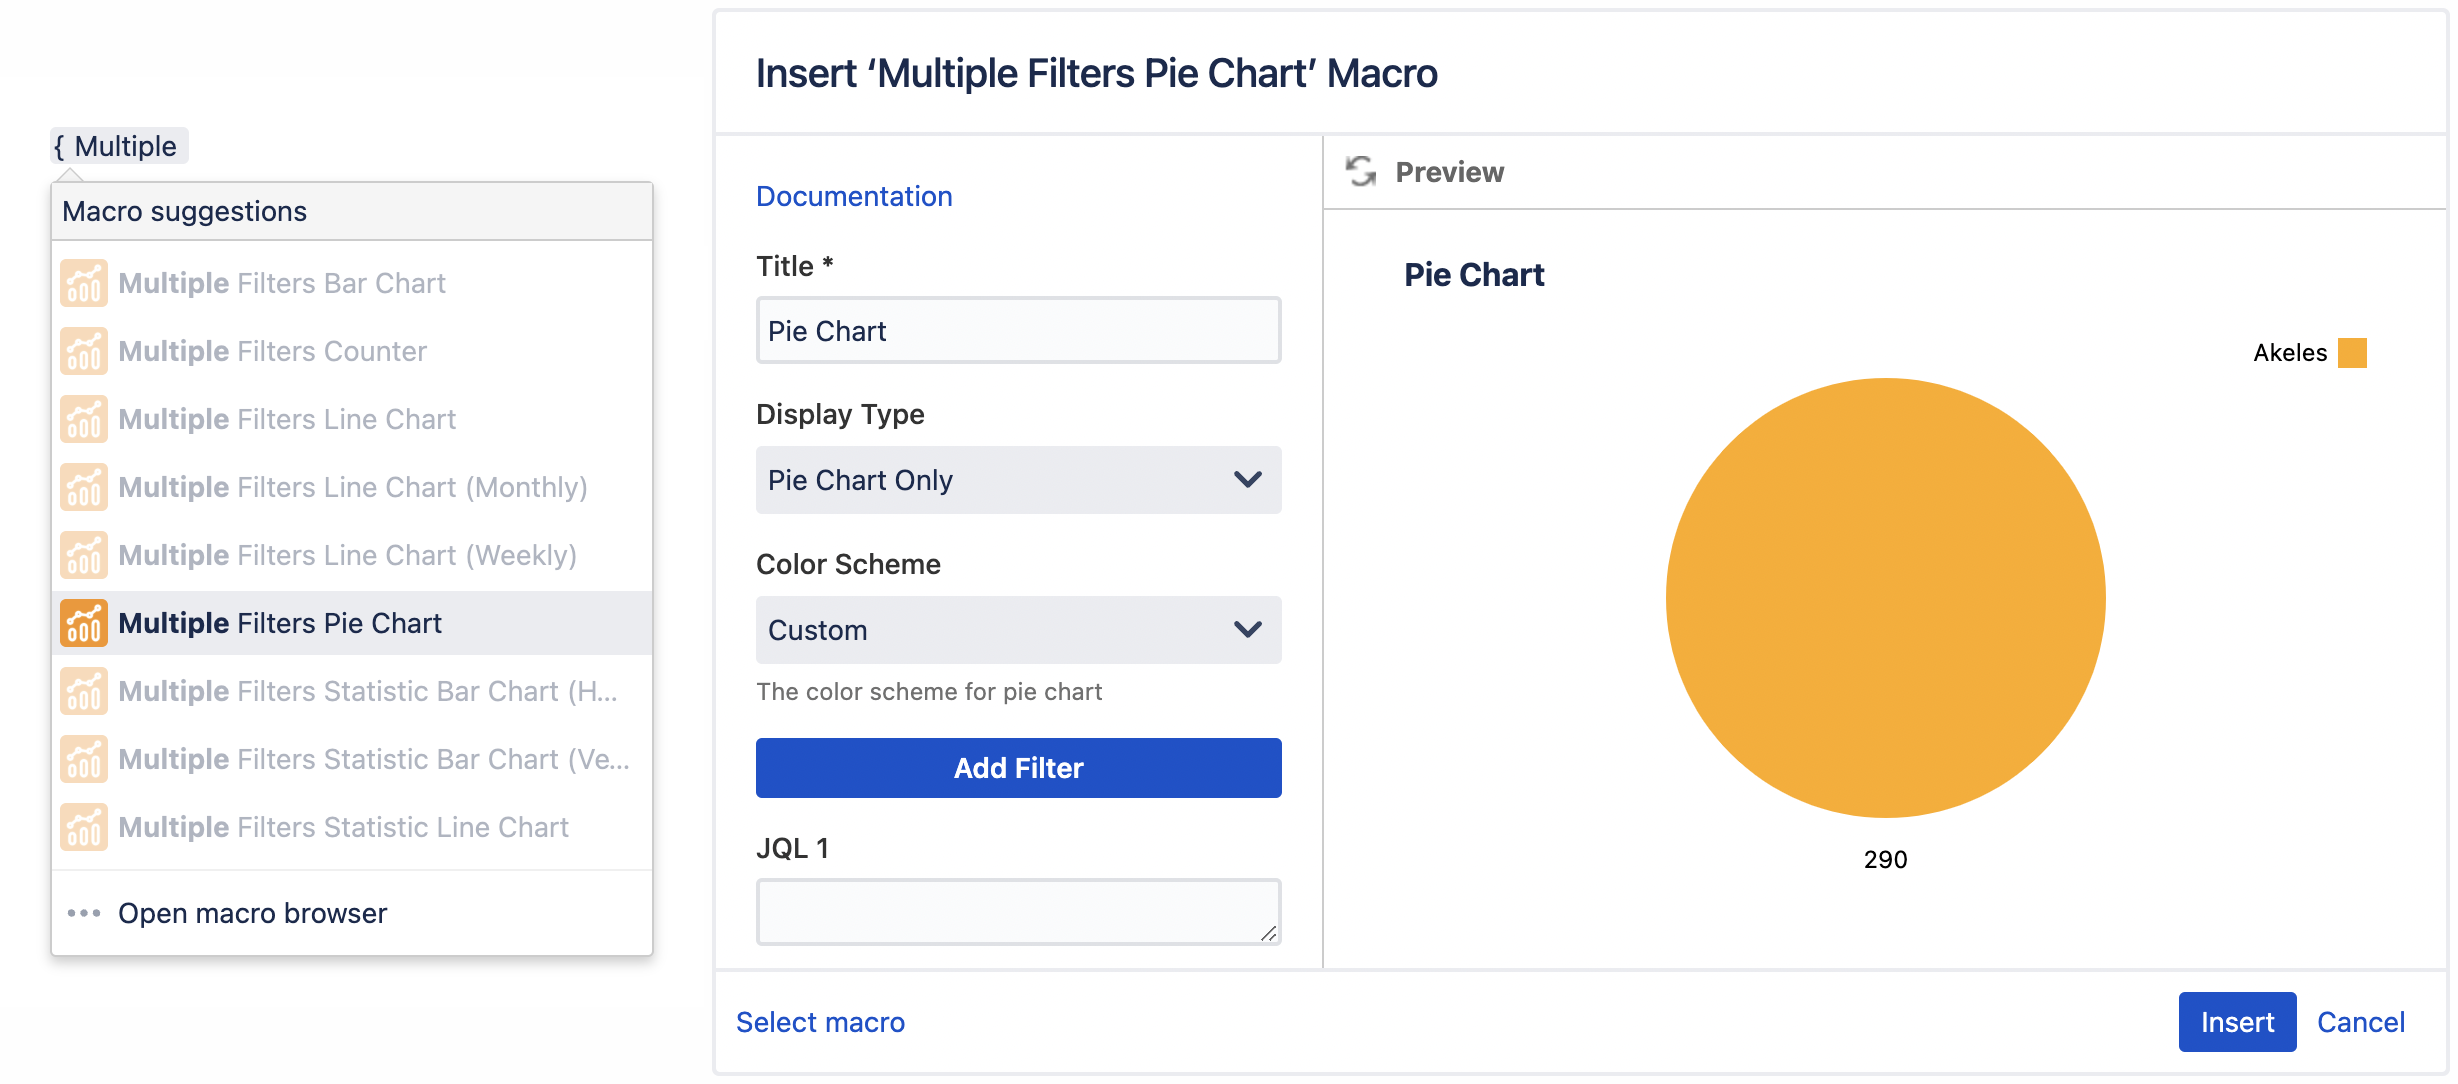
Configuring Multiple Filters Pie Chart Macro
Settings | Default | Description |
|---|---|---|
Title | Pie Chart | The title of the macro |
Display Type | Pie Chart Only | To display:
|
Color Scheme | Basic | The color scheme for pie chart:
|
Add Filter | Click to add filter *Maximum of 12 filters can be added. | |
JQL n | Enter JQL to get the Jira issues | |
Alias n | The display name for the filter | |
Color n | The color for the pie *Configurable only if Color Scheme is set to Custom | |
Calculation Mode | Issue Count | Display issue count or sum of number/time fields:
|
Display Time In | Hours | The unit to display time in:
*Applicable for Time Fields only |
Value Type | Number | The value type to display:
|
Data Labels | Show | The value for each pie slice:
|