Create a 3 slices pie chart
Overview
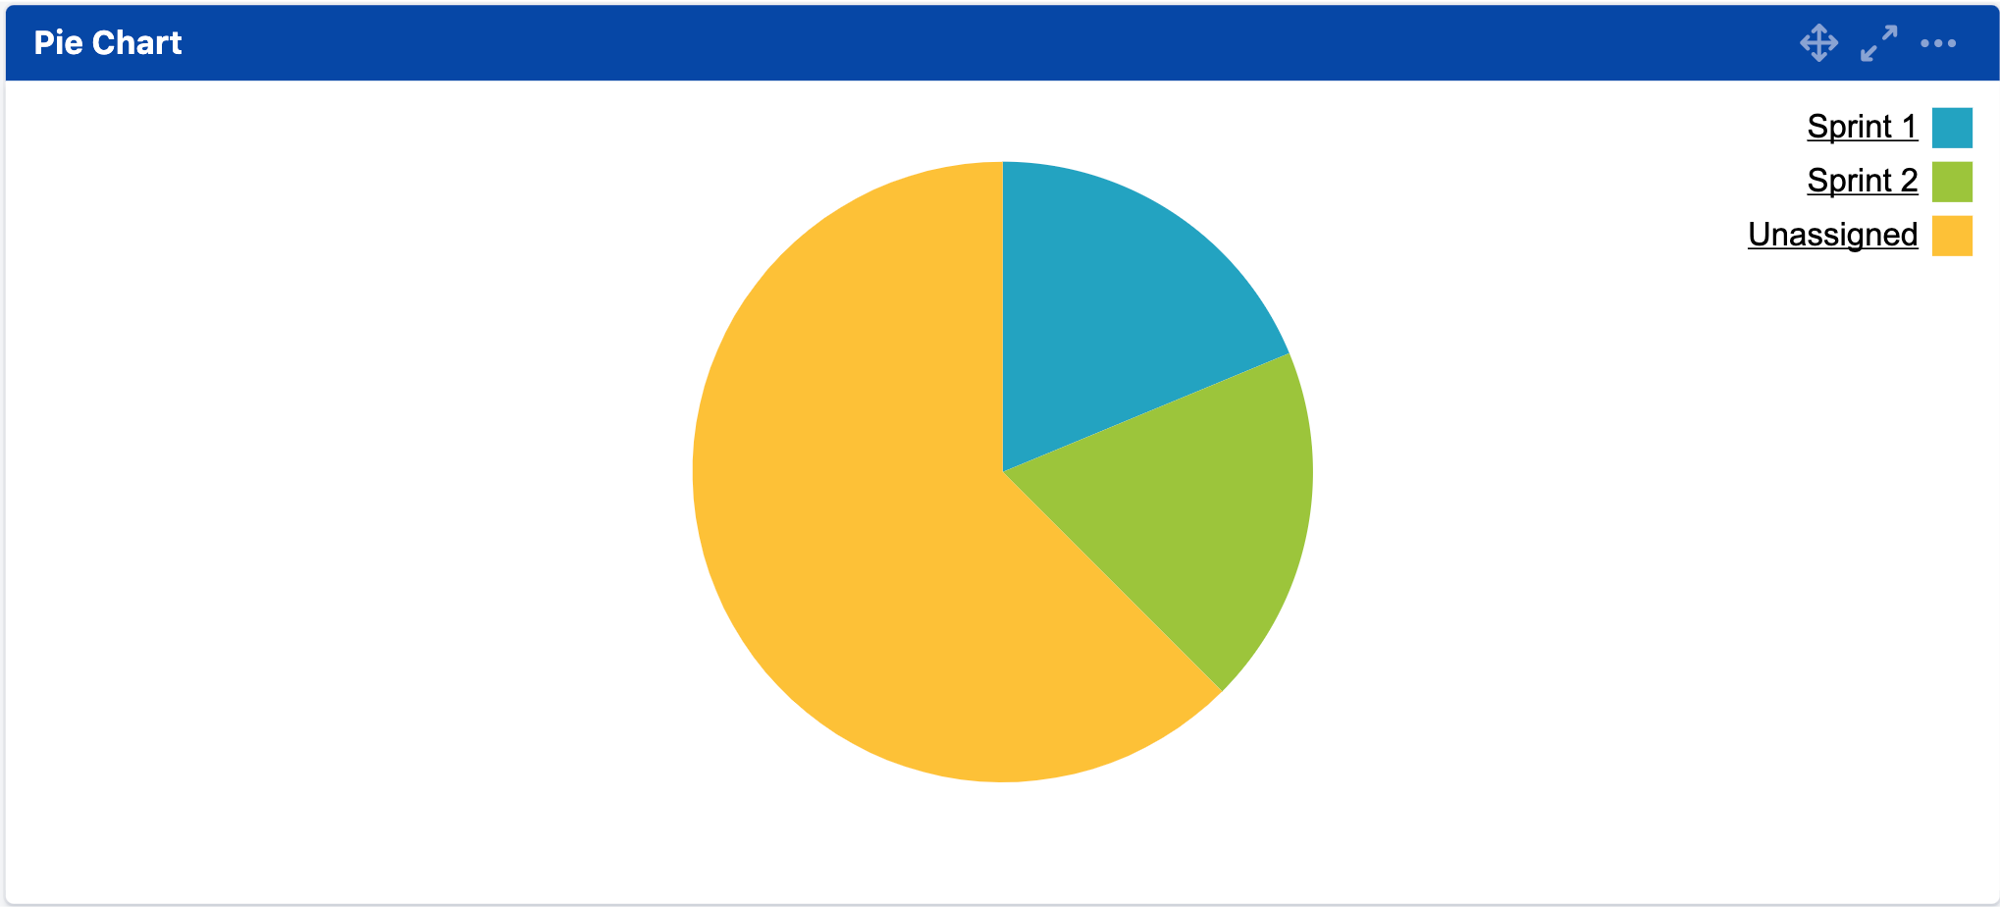
With the Multiple Filters Pie Chart Gadget, It is possible to create a 3 slices pie chart where each slice of the chart is based on a different JIRA filter.
As a project manager, there may be a need to see the number of issues in Sprint 1, Sprint 2 and Unassigned.
Set up
1. Create the following filters with the following JQL
Filter Name | Filter JQL |
|---|---|
[SCRUMT] Sprint 1 |
CODE
|
[SCRUMT] Sprint 2 |
CODE
|
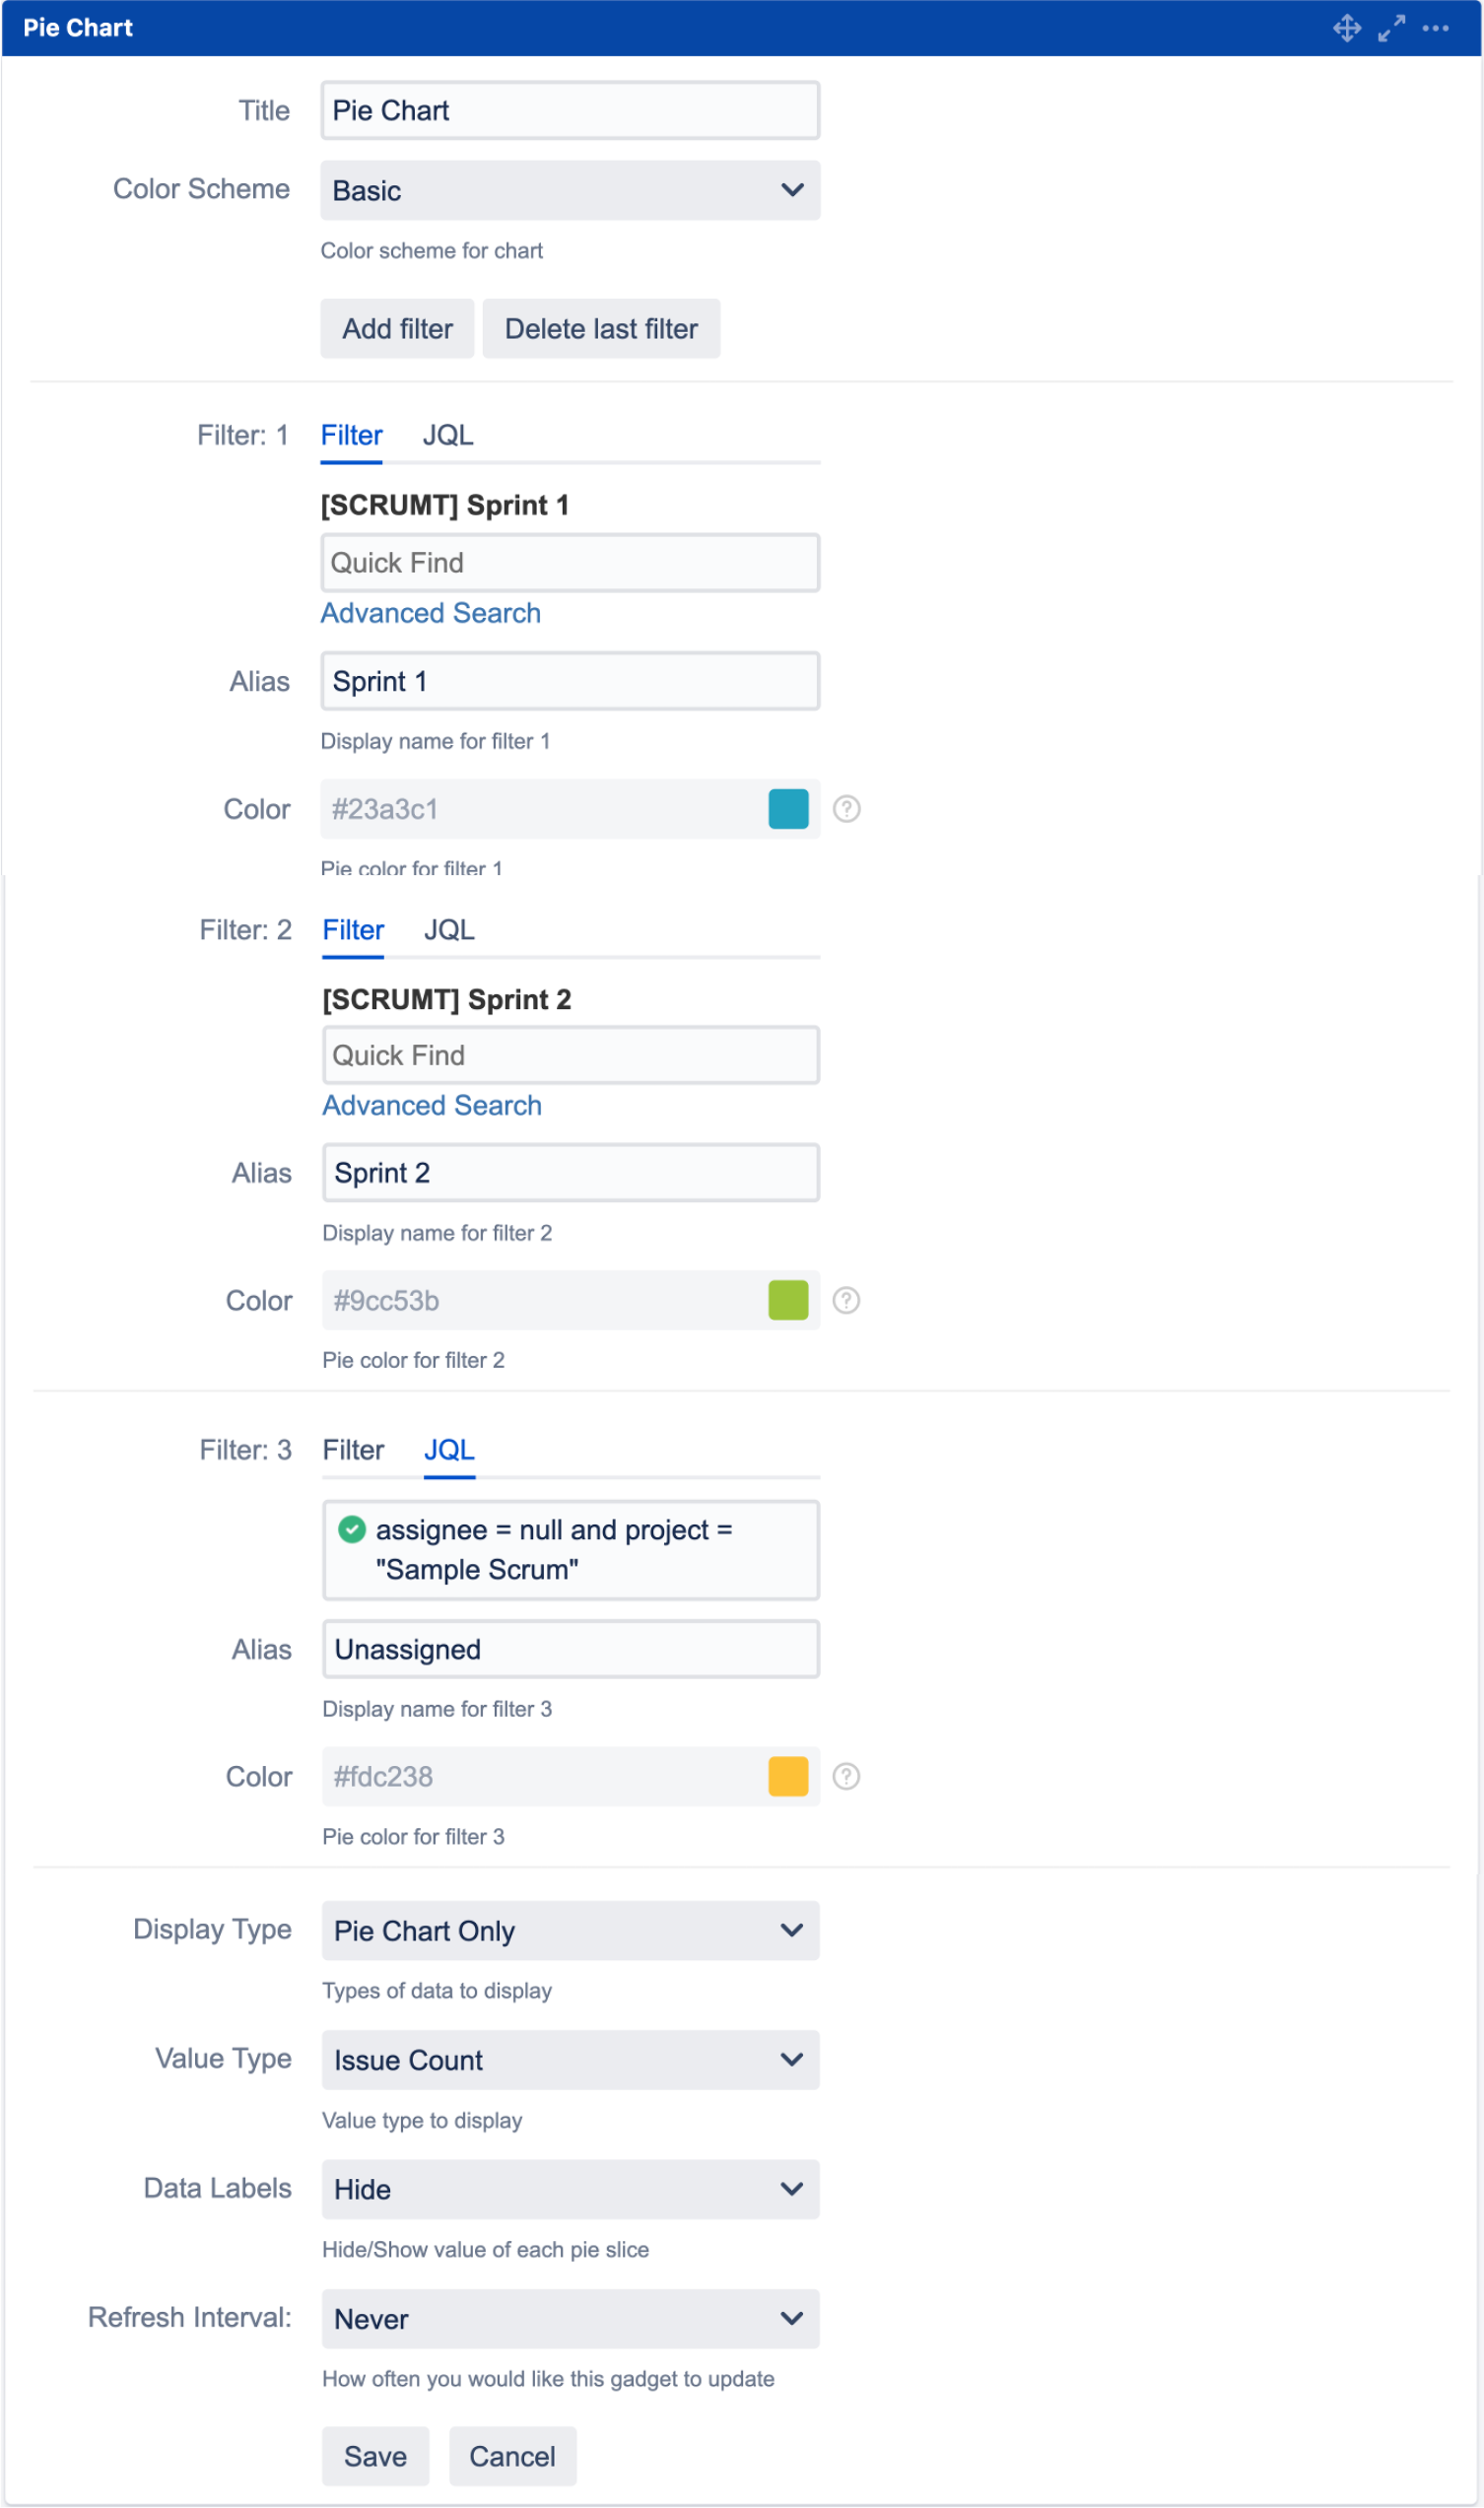
2. Add a Multiple Filters Pie Chart Gadget
Add a Multiple Filters Pie Chart Gadget in the dashboard
Click Add Filter two times to add 2 more filters
For the 1st filter, use [SCRUMT] Sprint 1, set Alias to Sprint 1
For the 2nd filter, use [SCRUMT] Sprint 2, set Alias to Sprint 2
For the 3rd filter, click JQL and enter the following,
CODEassignee = null and project = "Sample Scrum"Click Save