Review Dashboard Design Template
Introduction
Dashboards are a useful feature in Jira which is often underused or sometimes overused.
There are also cases where dashboards are built but unused.
This page provides some guidance on how to design a good dashboard so that people will want to use it
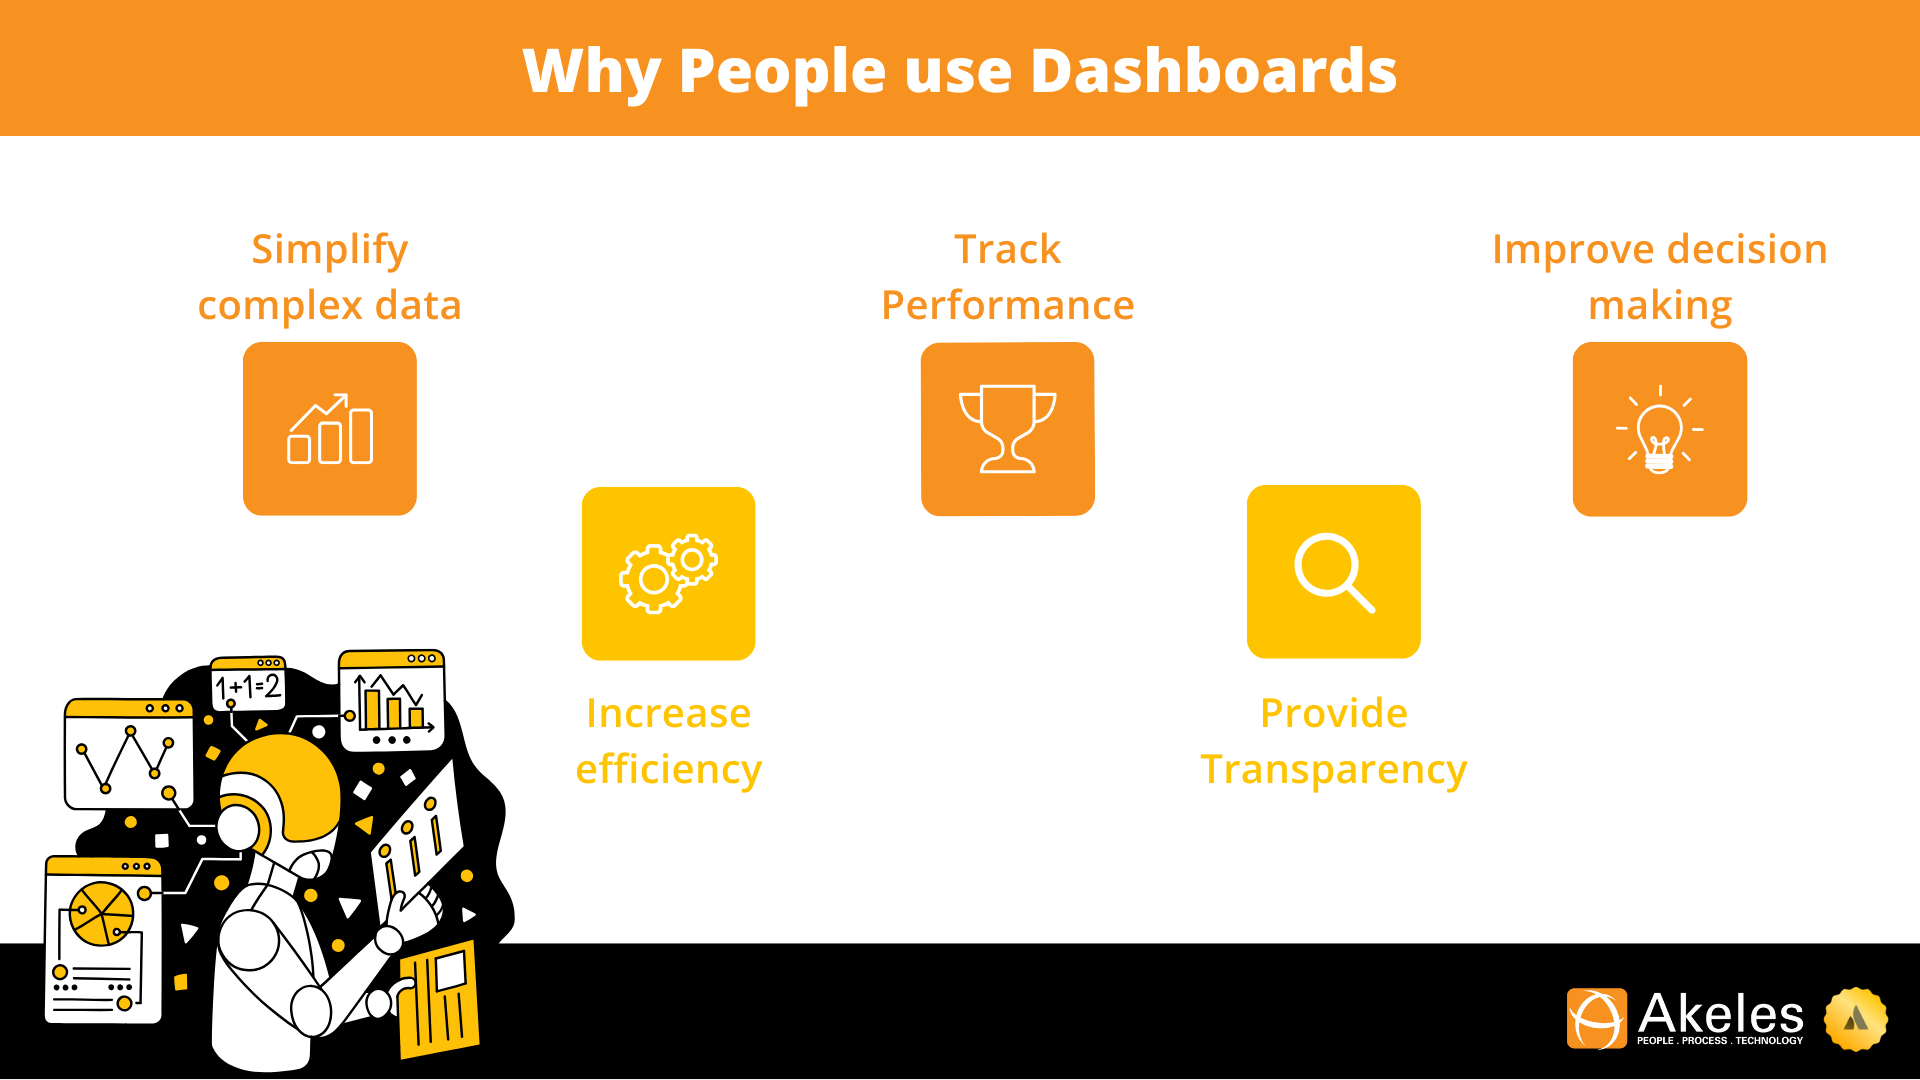
Purpose of Dashboards
Before designing a dashboard, we need to understand the purpose of dashboards
Purpose | Description |
|---|---|
Simplify complex data | Dashboards distill large volumes of data into key metrics that provide meaningful context. Rather than requiring users to analyze raw data, dashboards present information in an easily digestible format. |
Improve decision making | By displaying real-time or near-real-time information, dashboards enable timely decisions based on current data rather than outdated reports. |
Increase efficiency | Users can quickly absorb information from visual representations, reducing the time spent analyzing data and allowing more time for action. |
Provide Transparency | Dashboards create a single source of truth that can be shared across an organization, ensuring everyone works with the same information. |
Track Performance | They allow continuous monitoring of key performance indicators (KPIs) against established goals and benchmarks. |
How to design an effective dashboard
A well-designed dashboard transforms data into actionable insights by presenting the right information, to the right people, in the right way.
By understanding user needs, selecting meaningful metrics, applying thoughtful visual design principles, and continuously refining based on feedback, you can create dashboards that drive better decisions and improved outcomes.
Principle | How |
|---|---|
Understand Your Audience | Start by identifying who will use the dashboard and what decisions they need to make. Different users have different needs:
|
Define Clear Objectives | A good dashboard serves a specific purpose
|
Choose the Right Metrics | Select metrics that:
|
Apply Thoughtful Visual Design | A well designed dashboard makes it easier for people to read
|
Ensure Context and Relevance | Context transforms data into information:
|
Schedule Regular Reviews | Without regular use, dashboards can become outdated or misaligned with evolving business needs
|
Facilitate collaboration | Transform dashboards from passive information displays into active collaboration hubs
|
Template
We have prepared a template to guide
Name of Dashboard | |
|---|---|
Purpose | What is the purpose of this dashboard? What is it trying to achieve? |
Owner | Who is the person/team who owns this dashboard and can modify it later? |
Stakeholders | Who are the users who needs to review the dashboards
|
Review Period | How often should the dashboard be review? |
Metrics
You can fill in 1 row for each metric being tracked
What metric | Question | Why | How | When | What |
|---|---|---|---|---|---|
What is the metric being tracked? Examples:
| What question is this metric trying to answer? | Why is this important? | How can people visualize the metric easily? Which type of Jira gadgets is suitable? | When do people need to take action? (e.g. threshold) | What actions people need to take in response? |